

Answered step by step
Verified Expert Solution
Question
1 Approved Answer
Q2 (a) The schematic diagram of a flip-flop is as shown in Figure 2.1. S Q > C R Figure 2.1 A schematic digram of
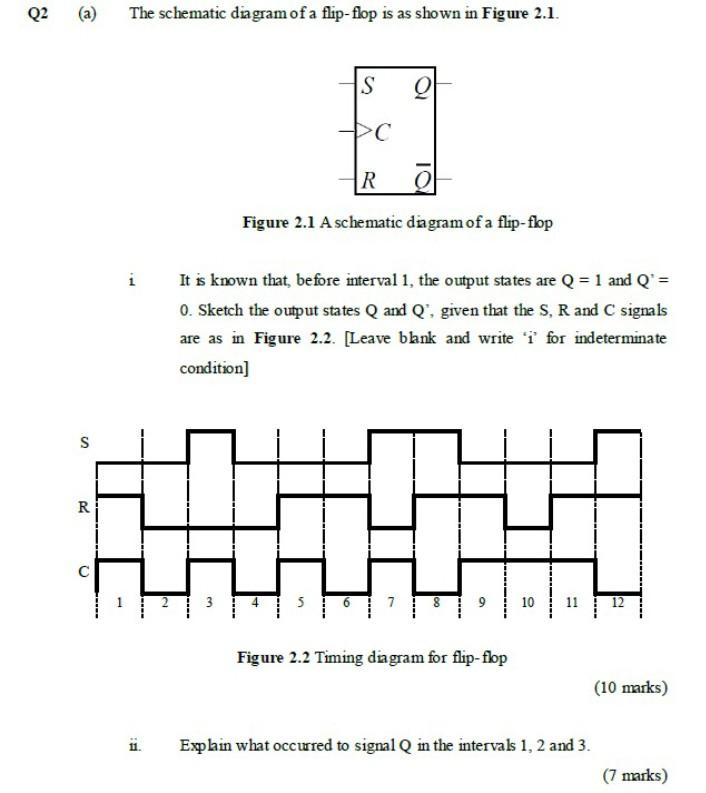
Q2 (a) The schematic diagram of a flip-flop is as shown in Figure 2.1. S Q > C R Figure 2.1 A schematic digram of a flip-flop It is known that, before interval 1, the output states are Q = 1 and Q = 0. Sketch the output states Q and Q, given that the S, R and C signals are as in Figure 2.2. [Leave bank and write i for indeterminate condition] S od 3 3 9 10 11 Figure 2.2 Timing diagram for flip-flop (10 marks) i. Explain what occured to signal Q in the intervals 1, 2 and 3. (7 marks)
Step by Step Solution
There are 3 Steps involved in it
Step: 1

Get Instant Access to Expert-Tailored Solutions
See step-by-step solutions with expert insights and AI powered tools for academic success
Step: 2

Step: 3
Ace Your Homework with AI
Get the answers you need in no time with our AI-driven, step-by-step assistance
Get Started
Current Trends In Database Technology Edbt 2004 Workshops Edbt 2004 Workshops Phd Datax Pim P2panddb And Clustweb Heraklion Crete Greece March 2004 Revised Selected Papers Lncs 3268
Authors: Wolfgang Lindner ,Marco Mesiti ,Can Turker ,Yannis Tzitzikas ,Athena Vakali
2005th Edition
3540233059, 978-3540233053