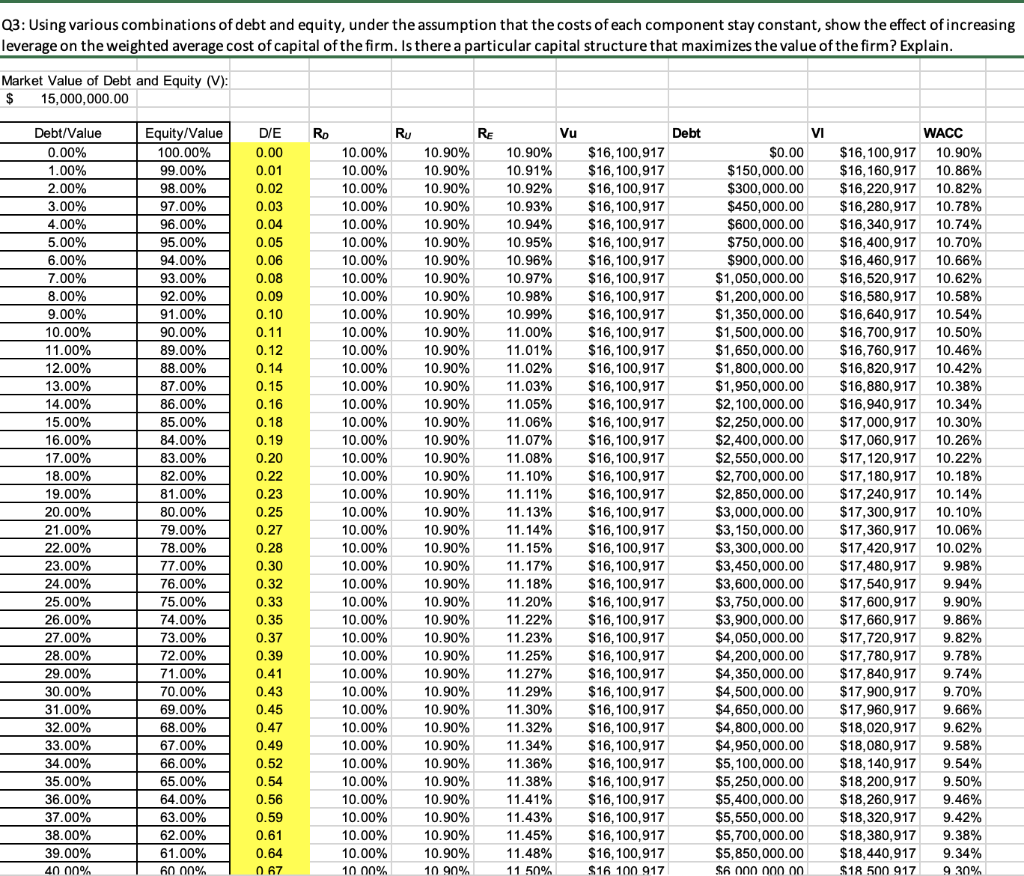
Q2: The firms beta was estimated at 1.1. Treasury bills were yielding 1% and the expected rate of return on the market index was estimated to be 10%. What is the current weighted average cost of capital of the firm? What effect would a change in the debt to equity ratio have on the weighted average cost of capital and the cost of equity capital of the firm?
PLEASE ANSWER Q2 & Q3 with explanations, thank you!


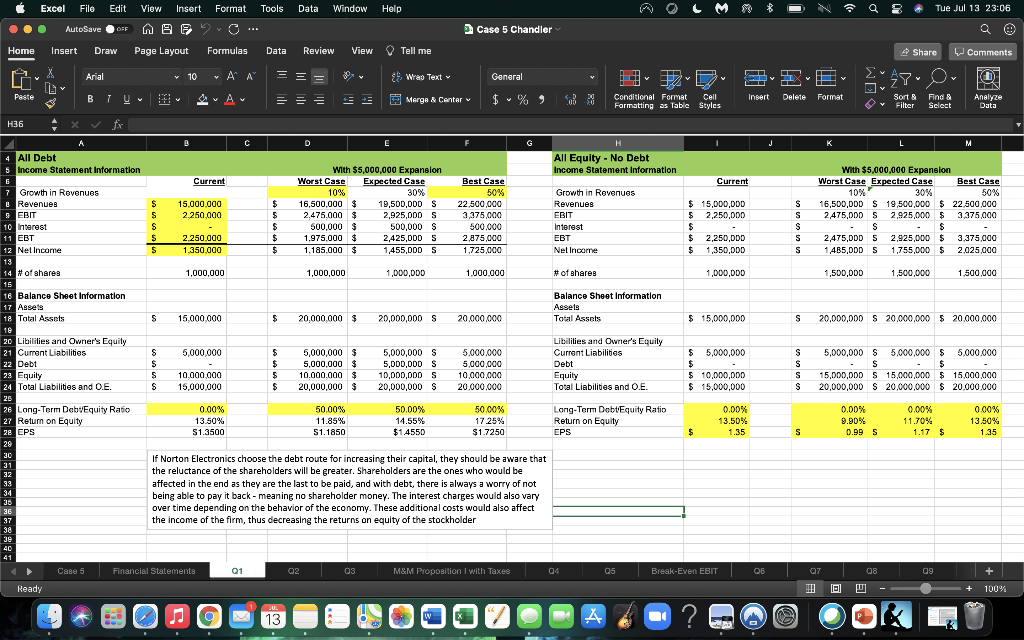
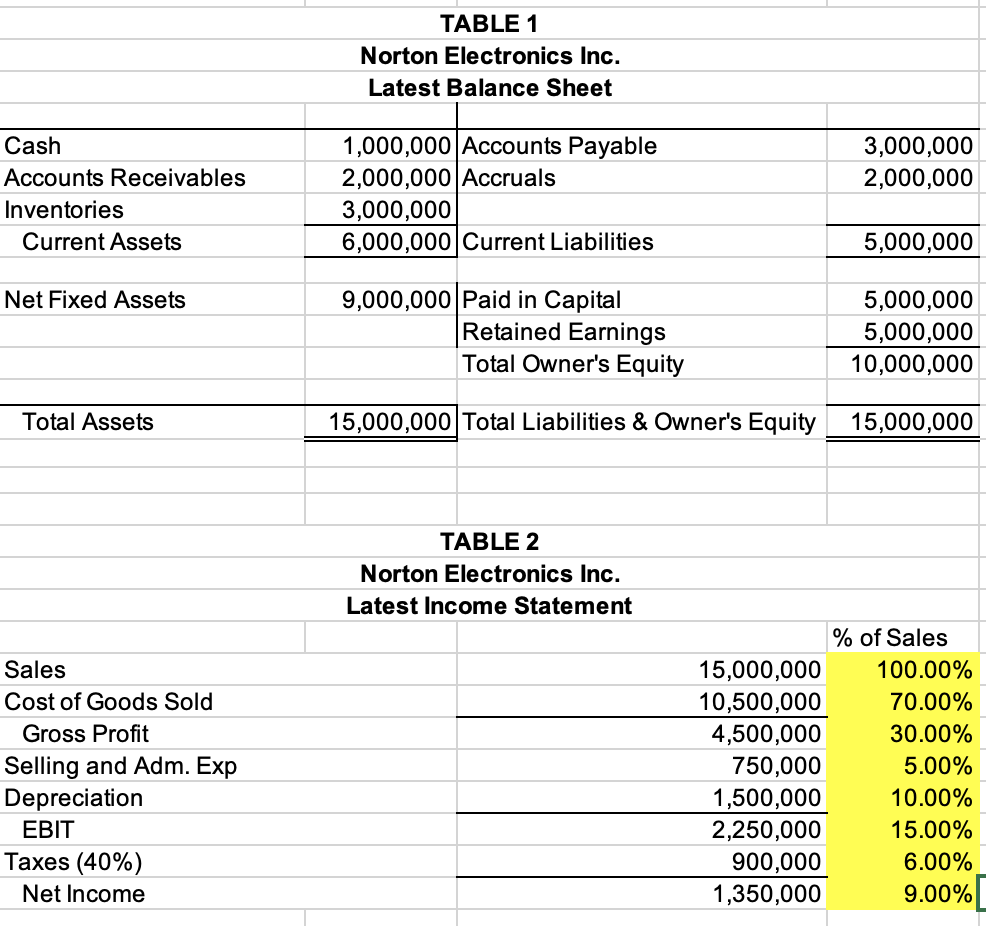
Q2: The firm's beta was estimated at 1.1. Treasury bills were yielding 1% and the expected rate of return on the market index was estimated to be 10%. What is the current weighted average cost of capital of the firm? What effect would a change in the debt to equity ratio have on the weighted average cost of capital and the cost of equity capital of the firm? 1.00% RA Beta RM Market Risk Premium 1.10 10.00% 9.00% 10.90% RE 30 10.00% Bonds Selling at Par Value, i.e. YTM = Coupon Rate Capital Structure Weights Debt/Value EquityValue R. RU Current WACC Proposed WACC D/E #DIV/0! #DIV/0! RE 10.00% #DIV/0! 10.00% #DIV/0! WACC 10.90% #DIV/O! 10.90% #DIV/0! Q3: Using various combinations of debt and equity, under the assumption that the costs of each component stay constant, show the effect of increasing leverage on the weighted average cost of capital of the firm. Is there a particular capital structure that maximizes the value of the firm? Explain. Market Value of Debt and Equity (V): $ 15,000,000.00 Debt Debt/Value 0.00% 1.00% 2.00% 3.00% 4.00% 5.00% 6.00% 7.00% 8.00% 9.00% 10.00% 11.00% 12.00% 13.00% 14.00% 15.00% 16.00% 17.00% 18.00% 19.00% 20.00% 21.00% 22.00% 23.00% 24.00% 25.00% 26.00% 27.00% 28.00% 29.00% 30.00% 31.00% 32.00% 33.00% 34.00% 35.00% 36.00% 37.00% 38.00% 39.00% 40.00% Equity/Value 100.00% 99.00% 98.00% 97.00% 96.00% 95.00% 94.00% 93.00% 92.00% 91.00% 90.00% 89.00% 88.00% 87.00% 86.00% 85.00% 84.00% 83.00% 82.00% 81.00% 80.00% 79.00% 78.00% 77.00% 76.00% 75.00% 74.00% 73.00% 72.00% 71.00% 70.00% 69.00% 68.00% 67.00% 66.00% 65.00% 64.00% 63.00% 62.00% 61.00% 60.00% DIE 0.00 0.01 0.02 0.03 0.04 0.05 0.06 0.08 0.09 0.10 0.11 0.12 0.14 0.15 0.16 0.18 0.19 0.20 0.22 0.23 0.25 0.27 0.28 0.30 0.32 0.33 0.35 0.37 0.39 0.41 0.43 0.45 0.47 0.49 0.52 0.54 0.56 0.59 0.61 0.64 067 Ro Ru RE 10.00% 10.90% 10.00% 10.90% 10.00% 10.90% 10.00% 10.90% 10.00% 10.90% 10.00% 10.90% 10.00% 10.90% 10.00% 10.90% 10.00% 10.90% 10.00% 10.90% 10.00% 10.90% 10.00% 10.90% 10.00% 10.90% 10.00% 10.90% 10.00% 10.90% 10.00% 10.90% 10.00% 10.90% 10.00% 10.90% 10.00% 10.90% 10.00% 10.90% 10.00% 10.90% 10.00% 10.90% 10.00% 10.90% 10.00% 10.90% 10.00% 10.90% 10.00% 10.90% 10.00% 10.90% 10.00% 10.90% 10.00% 10.90% 10.00% 10.90% 10.00% 10.90% 10.00% 10.90% 10.00% 10.90% 10.00% 10.90% 10.00% 10.90% 10.00% 10.90% 10.00% 10.90% 10.00% 10.90% 10.00% 10.90% 10.00% 10.90% 10.00% 10 90% Vu 10.90% 10.91% 10.92% 10.93% 10.94% 10.95% 10.96% 10.97% 10.98% 10.99% 11.00% 11.01% 11.02% 11.03% 11.05% 11.06% 11.07% 11.08% 11.10% 11.11% 11.13% 11.14% 11.15% 11.17% 11.18% 11.20% 11.22% 11.23% 11.25% 11.27% 11.29% 11.30% 11.32% 11.34% 11.36% 11.38% 11.41% 11.43% 11.45% 11.48% 11 50% $16, 100,917 $16,100,917 $16, 100,917 $16,100,917 $16, 100,917 $16, 100,917 $16, 100,917 $16, 100, 917 $16, 100,917 $16, 100, 917 $16,100,917 $16, 100,917 $16,100,917 $16,100,917 $16,100,917 $16,100,917 $16,100,917 $16,100,917 $16,100,917 $16,100,917 $16,100,917 $16,100,917 $16,100,917 $16,100,917 $16,100,917 $16, 100,917 $16,100,917 $16,100,917 $16,100,917 $16,100,917 $16, 100,917 $16,100,917 $16, 100,917 $16,100,917 $16, 100,917 $16, 100,917 $16, 100,917 $16, 100,917 $16,100,917 $16, 100,917 $16 100 917 VI $0.00 $150,000.00 $300,000.00 $450,000.00 $600,000.00 $750,000.00 $900,000.00 $1,050,000.00 $1,200,000.00 $1,350,000.00 $1,500,000.00 $1,650,000.00 $1,800,000.00 $1,950,000.00 $2,100,000.00 $2,250,000.00 $2,400,000.00 $2,550,000.00 $2,700,000.00 $2,850,000.00 $3,000,000.00 $3,150,000.00 $3,300,000.00 $3,450,000.00 $3,600,000.00 $3,750,000.00 $3,900,000.00 $4,050,000.00 $4,200,000.00 $4,350,000.00 $4,500,000.00 $4,650,000.00 $4,800,000.00 $4,950,000.00 $5,100,000.00 $5,250,000.00 $5,400,000.00 $5,550,000.00 $5,700,000.00 $5,850,000.00 $6 WACC $16,100,917 10.90% $16,160,917 10.86% $16,220,917 10.82% $16,280,917 10.78% $16,340,917 10.74% $16,400,917 10.70% $16,460,917 10.66% $16,520,917 10.62% $16,580,917 10.58% $16,640,917 10.54% $16,700,917 10.50% $16,760,917 10.46% $16,820,917 10.42% $16,880,917 10.38% $16,940,917 10.34% $17,000,917 10.30% $17,060,917 10.26% $17,120,917 10.22% $17,180,917 10.18% $17,240,917 10.14% $17,300,917 10.10% $17,360,917 10.06% $17,420,917 10.02% $17,480,917 9.98% $17,540,917 9.94% $17,600,917 9.90% $17,660,917 9.86% $17,720,917 9.82% $17,780,917 9.78% $17,840,917 9.74% $17,900,917 9.70% $17,960,917 9.66% $18,020,917 9.62% $18,080,917 9.58% $18, 140,917 9.54% $18,200,917 9.50% $18,260,917 9.46% $18,320,917 9.42% $18,380,917 9.38% $18,440,917 9.34% $18 500 917 9 30% Excel File Edit View Insert Format Tools Data Window Help a 2 Tue Jul 13 23:06 ... AutoSave OFF LUB MB2 Case 5 Chandler Home - Insert Draw Page Layout Formulas Data Review View Tell me Share Comments a X Arial V 10 VA APM == 9. Wrap Text General y O y Paste BT A = == 3 + + 11 Insert Merge & Centar Delete $ % 9 $ Format Conditional Format Cell Formatting as Table Styles Analyze Sort & Filter Find & Select Data H36 for K M S S S S S With $5,000,000 Expansion Worst Case Expected Case Best Case 10% 30% 50% 16,500,000 $ 19,500,000 $ 22.500.000 2,475,000 $2,925,000 $ 3,375,000 - S $ 2,475,0DD S 2,925,000 $ 3,375,000 14B5,00D S 1,755,000 $ 2.025,000 1,500,000 1,500,000 1.500.000 s 20,000,000 S 20,000,000 $20.000.000 A B C D E 4 All Debt All Equity - No Debt 5 Income Statement Information With $5,000,000 Expansion Income Statement Information E Current Worst Case Expected Case Best Case Current Growth in Revonuos 10% 30% 50% Growth in Revenues Revenues $ 15.000.000 $ 16.500.000 $ 19,500,000 S 22.500.000 Revenues $ 15,000,000 9 EBIT S 2.250.000 $ 2.475.000 $ 2,925,000 S 3,375,000 EBIT $ 2,250,000 10 Interest S $ $ 500,000 $ 500,000 $ 500.000 Interest $ 11 EBT $ 2.250.000 $ 1.975,000 $ 2,425,00D S 2.875,000 EBT $ 2,250,000 12 Net Income $ 1.350.000 $ 1.185.000 $ 1,455,000 S 1.725.000 Net Incarne $ 1,350,000 13 14 # of shares 1,000,000 1,000,000 1,000,000 1.000.000 # of shares 1,000,000 15 16 Balance Sheet Information Balance Sheet Information 17 Assets Assets 18 Total Assets S 15.000.000 $ 20.000.000 $ 20,000,000 S 20.000.000 Total Assets $ 15,000,000 10 20 Libilities and Owner's Equity Libilities and Owner's Equity 21 Current Liabilities S 5,000,000 $ $ 5,000,000 $ 5,000,000 S 5.000.000 Current Liabilities $ 5,000,000 22 Debt $ $ 5,000,000 $ 5,000,000 $ 5.000.000 Debt $ 23 Equity S 10.000.000 $ 10.000.000 $ 10,000,000 S 10,000,000 Equity $ 10,000,000 24 Total Liabilities and O.E. S 15,000,000 $ 20,000,000 $ 20,000,000 S 20.000.000 Total Liabilities and O.E. $ 15,000,000 26 26 Long-Term DebvEquity Ratio 0.00% % 50.00% 50.00% 50.00% Long-Term Debt Equity Ratio 0.00% 27 Return on Equity 13.50% 11.85% 14.55% 17 25% Return on Equity 13.50% 28 CPS S1.3500 51.1850 $1.4550 $1.7250 EPS $ 1.35 29 30 31 If Norton Electronics choose the debt route for increasing their capital, they should be aware that 32 the reluctance of the shareholders will be greater. Shareholders are the ones who would be 33 affected in the end as they are the last to be paid, and with debt, there is always a worry of not 34 being able to pay it back - meaning no shareholder money. The interest charges would also vary 38 3E over time depending on the behavior of the economy. These additional costs would also affect 37 the income of the firm, thus decreasing the returns on equity of the stockholder 38 30 40 41 Cases Financial Statements Q1 02 OS M&M Proposition I with Taxes 04 05 Break-Even EBIT Ready S S S S 5,000,000 S 5.000.000 $ 5.000.000 S $ 15,000,000 $ 15,000,000 $ 15,000,000 20,000,000 S 20,000,000 $20,000,000 0.00% 0.00% 0.00% 9.90% 11.70% 13.50% 0.99 S 1.17 $ 1.35 S 08 09 + Q7 !!! U + 100% JU. 13 A ve TABLE 1 Norton Electronics Inc. Latest Balance Sheet 3,000,000 2,000,000 Cash Accounts Receivables Inventories Current Assets 1,000,000 Accounts Payable 2,000,000 Accruals 3,000,000 6,000,000 Current Liabilities 5,000,000 Net Fixed Assets 9,000,000 Paid in Capital Retained Earnings Total Owner's Equity 5,000,000 5,000,000 10,000,000 Total Assets 15,000,000 Total Liabilities & Owner's Equity 15,000,000 TABLE 2 Norton Electronics Inc. Latest Income Statement Sales Cost of Goods Sold Gross Profit Selling and Adm. Exp Depreciation EBIT Taxes (40%) Net Income % of Sales 15,000,000 100.00% 10,500,000 70.00% 4,500,000 30.00% 750,000 5.00% 1,500,000 10.00% 2,250,000 15.00% 900,000 6.00% 1,350,000 9.00% Q2: The firm's beta was estimated at 1.1. Treasury bills were yielding 1% and the expected rate of return on the market index was estimated to be 10%. What is the current weighted average cost of capital of the firm? What effect would a change in the debt to equity ratio have on the weighted average cost of capital and the cost of equity capital of the firm? 1.00% RA Beta RM Market Risk Premium 1.10 10.00% 9.00% 10.90% RE 30 10.00% Bonds Selling at Par Value, i.e. YTM = Coupon Rate Capital Structure Weights Debt/Value EquityValue R. RU Current WACC Proposed WACC D/E #DIV/0! #DIV/0! RE 10.00% #DIV/0! 10.00% #DIV/0! WACC 10.90% #DIV/O! 10.90% #DIV/0! Q3: Using various combinations of debt and equity, under the assumption that the costs of each component stay constant, show the effect of increasing leverage on the weighted average cost of capital of the firm. Is there a particular capital structure that maximizes the value of the firm? Explain. Market Value of Debt and Equity (V): $ 15,000,000.00 Debt Debt/Value 0.00% 1.00% 2.00% 3.00% 4.00% 5.00% 6.00% 7.00% 8.00% 9.00% 10.00% 11.00% 12.00% 13.00% 14.00% 15.00% 16.00% 17.00% 18.00% 19.00% 20.00% 21.00% 22.00% 23.00% 24.00% 25.00% 26.00% 27.00% 28.00% 29.00% 30.00% 31.00% 32.00% 33.00% 34.00% 35.00% 36.00% 37.00% 38.00% 39.00% 40.00% Equity/Value 100.00% 99.00% 98.00% 97.00% 96.00% 95.00% 94.00% 93.00% 92.00% 91.00% 90.00% 89.00% 88.00% 87.00% 86.00% 85.00% 84.00% 83.00% 82.00% 81.00% 80.00% 79.00% 78.00% 77.00% 76.00% 75.00% 74.00% 73.00% 72.00% 71.00% 70.00% 69.00% 68.00% 67.00% 66.00% 65.00% 64.00% 63.00% 62.00% 61.00% 60.00% DIE 0.00 0.01 0.02 0.03 0.04 0.05 0.06 0.08 0.09 0.10 0.11 0.12 0.14 0.15 0.16 0.18 0.19 0.20 0.22 0.23 0.25 0.27 0.28 0.30 0.32 0.33 0.35 0.37 0.39 0.41 0.43 0.45 0.47 0.49 0.52 0.54 0.56 0.59 0.61 0.64 067 Ro Ru RE 10.00% 10.90% 10.00% 10.90% 10.00% 10.90% 10.00% 10.90% 10.00% 10.90% 10.00% 10.90% 10.00% 10.90% 10.00% 10.90% 10.00% 10.90% 10.00% 10.90% 10.00% 10.90% 10.00% 10.90% 10.00% 10.90% 10.00% 10.90% 10.00% 10.90% 10.00% 10.90% 10.00% 10.90% 10.00% 10.90% 10.00% 10.90% 10.00% 10.90% 10.00% 10.90% 10.00% 10.90% 10.00% 10.90% 10.00% 10.90% 10.00% 10.90% 10.00% 10.90% 10.00% 10.90% 10.00% 10.90% 10.00% 10.90% 10.00% 10.90% 10.00% 10.90% 10.00% 10.90% 10.00% 10.90% 10.00% 10.90% 10.00% 10.90% 10.00% 10.90% 10.00% 10.90% 10.00% 10.90% 10.00% 10.90% 10.00% 10.90% 10.00% 10 90% Vu 10.90% 10.91% 10.92% 10.93% 10.94% 10.95% 10.96% 10.97% 10.98% 10.99% 11.00% 11.01% 11.02% 11.03% 11.05% 11.06% 11.07% 11.08% 11.10% 11.11% 11.13% 11.14% 11.15% 11.17% 11.18% 11.20% 11.22% 11.23% 11.25% 11.27% 11.29% 11.30% 11.32% 11.34% 11.36% 11.38% 11.41% 11.43% 11.45% 11.48% 11 50% $16, 100,917 $16,100,917 $16, 100,917 $16,100,917 $16, 100,917 $16, 100,917 $16, 100,917 $16, 100, 917 $16, 100,917 $16, 100, 917 $16,100,917 $16, 100,917 $16,100,917 $16,100,917 $16,100,917 $16,100,917 $16,100,917 $16,100,917 $16,100,917 $16,100,917 $16,100,917 $16,100,917 $16,100,917 $16,100,917 $16,100,917 $16, 100,917 $16,100,917 $16,100,917 $16,100,917 $16,100,917 $16, 100,917 $16,100,917 $16, 100,917 $16,100,917 $16, 100,917 $16, 100,917 $16, 100,917 $16, 100,917 $16,100,917 $16, 100,917 $16 100 917 VI $0.00 $150,000.00 $300,000.00 $450,000.00 $600,000.00 $750,000.00 $900,000.00 $1,050,000.00 $1,200,000.00 $1,350,000.00 $1,500,000.00 $1,650,000.00 $1,800,000.00 $1,950,000.00 $2,100,000.00 $2,250,000.00 $2,400,000.00 $2,550,000.00 $2,700,000.00 $2,850,000.00 $3,000,000.00 $3,150,000.00 $3,300,000.00 $3,450,000.00 $3,600,000.00 $3,750,000.00 $3,900,000.00 $4,050,000.00 $4,200,000.00 $4,350,000.00 $4,500,000.00 $4,650,000.00 $4,800,000.00 $4,950,000.00 $5,100,000.00 $5,250,000.00 $5,400,000.00 $5,550,000.00 $5,700,000.00 $5,850,000.00 $6 WACC $16,100,917 10.90% $16,160,917 10.86% $16,220,917 10.82% $16,280,917 10.78% $16,340,917 10.74% $16,400,917 10.70% $16,460,917 10.66% $16,520,917 10.62% $16,580,917 10.58% $16,640,917 10.54% $16,700,917 10.50% $16,760,917 10.46% $16,820,917 10.42% $16,880,917 10.38% $16,940,917 10.34% $17,000,917 10.30% $17,060,917 10.26% $17,120,917 10.22% $17,180,917 10.18% $17,240,917 10.14% $17,300,917 10.10% $17,360,917 10.06% $17,420,917 10.02% $17,480,917 9.98% $17,540,917 9.94% $17,600,917 9.90% $17,660,917 9.86% $17,720,917 9.82% $17,780,917 9.78% $17,840,917 9.74% $17,900,917 9.70% $17,960,917 9.66% $18,020,917 9.62% $18,080,917 9.58% $18, 140,917 9.54% $18,200,917 9.50% $18,260,917 9.46% $18,320,917 9.42% $18,380,917 9.38% $18,440,917 9.34% $18 500 917 9 30% Excel File Edit View Insert Format Tools Data Window Help a 2 Tue Jul 13 23:06 ... AutoSave OFF LUB MB2 Case 5 Chandler Home - Insert Draw Page Layout Formulas Data Review View Tell me Share Comments a X Arial V 10 VA APM == 9. Wrap Text General y O y Paste BT A = == 3 + + 11 Insert Merge & Centar Delete $ % 9 $ Format Conditional Format Cell Formatting as Table Styles Analyze Sort & Filter Find & Select Data H36 for K M S S S S S With $5,000,000 Expansion Worst Case Expected Case Best Case 10% 30% 50% 16,500,000 $ 19,500,000 $ 22.500.000 2,475,000 $2,925,000 $ 3,375,000 - S $ 2,475,0DD S 2,925,000 $ 3,375,000 14B5,00D S 1,755,000 $ 2.025,000 1,500,000 1,500,000 1.500.000 s 20,000,000 S 20,000,000 $20.000.000 A B C D E 4 All Debt All Equity - No Debt 5 Income Statement Information With $5,000,000 Expansion Income Statement Information E Current Worst Case Expected Case Best Case Current Growth in Revonuos 10% 30% 50% Growth in Revenues Revenues $ 15.000.000 $ 16.500.000 $ 19,500,000 S 22.500.000 Revenues $ 15,000,000 9 EBIT S 2.250.000 $ 2.475.000 $ 2,925,000 S 3,375,000 EBIT $ 2,250,000 10 Interest S $ $ 500,000 $ 500,000 $ 500.000 Interest $ 11 EBT $ 2.250.000 $ 1.975,000 $ 2,425,00D S 2.875,000 EBT $ 2,250,000 12 Net Income $ 1.350.000 $ 1.185.000 $ 1,455,000 S 1.725.000 Net Incarne $ 1,350,000 13 14 # of shares 1,000,000 1,000,000 1,000,000 1.000.000 # of shares 1,000,000 15 16 Balance Sheet Information Balance Sheet Information 17 Assets Assets 18 Total Assets S 15.000.000 $ 20.000.000 $ 20,000,000 S 20.000.000 Total Assets $ 15,000,000 10 20 Libilities and Owner's Equity Libilities and Owner's Equity 21 Current Liabilities S 5,000,000 $ $ 5,000,000 $ 5,000,000 S 5.000.000 Current Liabilities $ 5,000,000 22 Debt $ $ 5,000,000 $ 5,000,000 $ 5.000.000 Debt $ 23 Equity S 10.000.000 $ 10.000.000 $ 10,000,000 S 10,000,000 Equity $ 10,000,000 24 Total Liabilities and O.E. S 15,000,000 $ 20,000,000 $ 20,000,000 S 20.000.000 Total Liabilities and O.E. $ 15,000,000 26 26 Long-Term DebvEquity Ratio 0.00% % 50.00% 50.00% 50.00% Long-Term Debt Equity Ratio 0.00% 27 Return on Equity 13.50% 11.85% 14.55% 17 25% Return on Equity 13.50% 28 CPS S1.3500 51.1850 $1.4550 $1.7250 EPS $ 1.35 29 30 31 If Norton Electronics choose the debt route for increasing their capital, they should be aware that 32 the reluctance of the shareholders will be greater. Shareholders are the ones who would be 33 affected in the end as they are the last to be paid, and with debt, there is always a worry of not 34 being able to pay it back - meaning no shareholder money. The interest charges would also vary 38 3E over time depending on the behavior of the economy. These additional costs would also affect 37 the income of the firm, thus decreasing the returns on equity of the stockholder 38 30 40 41 Cases Financial Statements Q1 02 OS M&M Proposition I with Taxes 04 05 Break-Even EBIT Ready S S S S 5,000,000 S 5.000.000 $ 5.000.000 S $ 15,000,000 $ 15,000,000 $ 15,000,000 20,000,000 S 20,000,000 $20,000,000 0.00% 0.00% 0.00% 9.90% 11.70% 13.50% 0.99 S 1.17 $ 1.35 S 08 09 + Q7 !!! U + 100% JU. 13 A ve TABLE 1 Norton Electronics Inc. Latest Balance Sheet 3,000,000 2,000,000 Cash Accounts Receivables Inventories Current Assets 1,000,000 Accounts Payable 2,000,000 Accruals 3,000,000 6,000,000 Current Liabilities 5,000,000 Net Fixed Assets 9,000,000 Paid in Capital Retained Earnings Total Owner's Equity 5,000,000 5,000,000 10,000,000 Total Assets 15,000,000 Total Liabilities & Owner's Equity 15,000,000 TABLE 2 Norton Electronics Inc. Latest Income Statement Sales Cost of Goods Sold Gross Profit Selling and Adm. Exp Depreciation EBIT Taxes (40%) Net Income % of Sales 15,000,000 100.00% 10,500,000 70.00% 4,500,000 30.00% 750,000 5.00% 1,500,000 10.00% 2,250,000 15.00% 900,000 6.00% 1,350,000 9.00%


