

Question
Q2. The following data consists of the length of service call in minutes and the number of components repaired. i) Draw a scatter diagram and
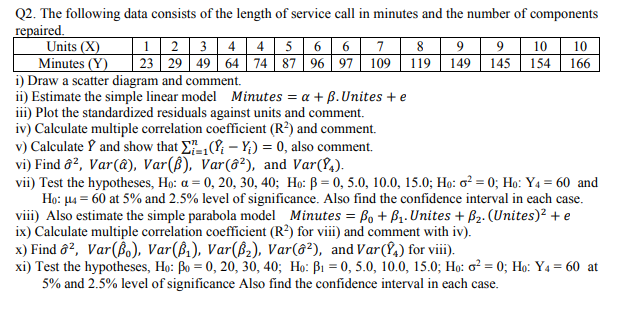
Q2. The following data consists of the length of service call in minutes and the number of components\ repaired.\ i) Draw a scatter diagram and comment.\ ii) Estimate the simple linear model Minutes
=\\\\alpha +\\\\beta . Unites
+e\ iii) Plot the standardized residuals against units and comment.\ iv) Calculate multiple correlation coefficient
(R^(2))and comment.\ v) Calculate
hat(Y)and show that
\\\\sum_(i=1)^n (hat(Y)_(i)-Y_(i))=0, also comment.\ vi) Find
hat(\\\\sigma )^(2),Var(hat(\\\\alpha )),Var(hat(\\\\beta )),Var(hat(\\\\sigma )^(2)), and
Var(hat(P)_(4)).\ vii) Test the hypotheses,
H_(0):\\\\alpha =0,20,30,40;H_(0):\\\\beta =0,5.0,10.0,15.0;H_(0):\\\\sigma ^(2)=0;H_(0):Y_(4)=60and\
H_(0):\\\\mu _(4)=60at
5%and
2.5%level of significance. Also find the confidence interval in each case.\ viii) Also estimate the simple parabola model Minutes
=\\\\beta _(0)+\\\\beta _(1). Unites
+\\\\beta _(2).
( Unites )^(2)+e\ ix) Calculate multiple correlation coefficient
(R^(2))for viii) and comment with iv).\ x) Find
hat(\\\\sigma )^(2),Var(hat(\\\\beta )_(0)),Var(hat(\\\\beta )_(1)),Var(hat(\\\\beta )_(2)),Var(hat(\\\\sigma )^(2)), and
Var(hat(\\\\beta )_(4))for viii).\ xi) Test the hypotheses,
H_(0):\\\\beta _(0)=0,20,30,40;H_(0):\\\\beta _(1)=0,5.0,10.0,15.0;H_(0):\\\\sigma ^(2)=0;H_(0):Y_(4)=60at\
5%and
2.5%level of significance Also find the confidence interval in each case.
Step by Step Solution
There are 3 Steps involved in it
Step: 1

Get Instant Access to Expert-Tailored Solutions
See step-by-step solutions with expert insights and AI powered tools for academic success
Step: 2

Step: 3
Ace Your Homework with AI
Get the answers you need in no time with our AI-driven, step-by-step assistance
Get Started
The Oxford Handbook Of Credit Derivatives
Authors: Alexander Lipton, Andrew Rennie
1st Edition
0199546789, 978-0199546787