

Question
Q2. Today McDonald's (MCD) stock is trading at $163.58 per share. The price of a put option on MCD expiring in 3 months with exercise
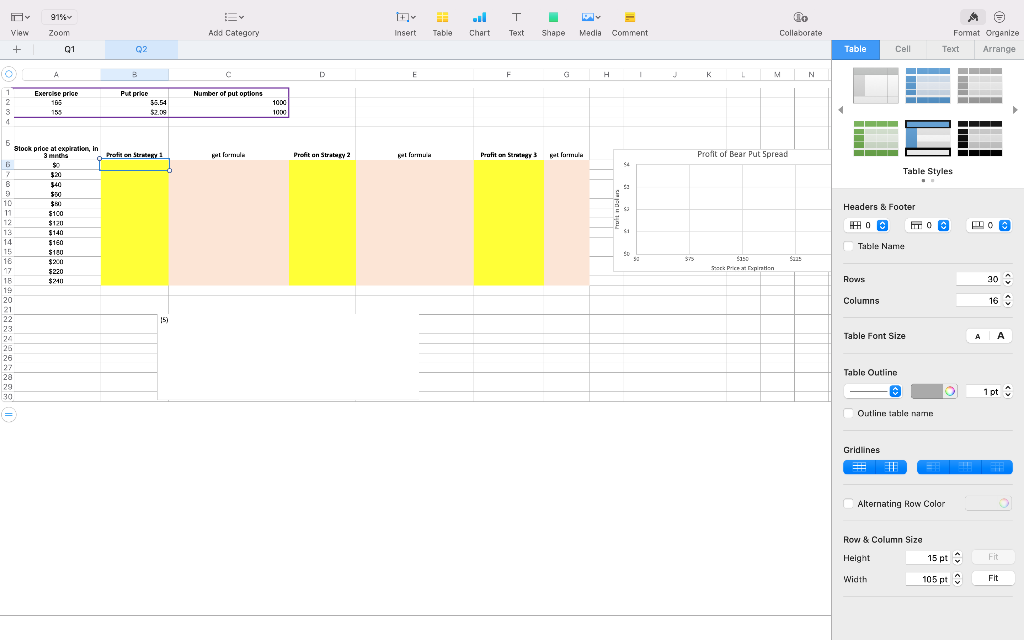
Q2. Today McDonald's (MCD) stock is trading at $163.58 per share. The price of a put option on MCD expiring in 3 months with exercise price K = $155 is $2.09 and with K =$165 is $5.54 Assume MCD stock price can take a value between $0 to $240, with increments of $20, in 3 months. Given the range of possible stock prices of MCD on expiration date, calculate the profits of the following investment strategies:
(1) Buying 1,000 put options on MCD with an exercise price of $165 (1 point)
(2) Selling 1,000 put options on MCD with an exercise price of $155 (1 point)
(3) Buying 1,000 put options on MCD with an exercise price of $165 and selling 1,000 put options on MCD with an exercise price of $155 (1 point).
(4) Plot your results from (3) with a scatter chart to display the Profit function of the strategy in (3) (1 point)
(5) What is the name of the strategy in (3)? Do you bet on a MCD price increase or decrease with this strategy? Write your answer in a textbox.
91% + ul Chart T Text co Collaborate View Zoom Add Category Insert Table Shape Media Comment O Format Organize Text Arrange + Q1 Q2 Table Cell A 3 C D E F G H 1 L N Number of put options 2 Exercise price 165 155 Put prke 58.54 $2.19 1000 1000 4 CI Profit on streky 1 llormula Profit on Strategy 2 Bowl formu Prufiton llum Profit of Bear Put Spread 64 Table Styles 53 Headers & Footer HOC MO TO 31 Table Name 5 Stock proe at expiration, in 3 inds G $ $20 8 $40 $30 10 $5. 11 $100 12 $1211 13 $140 14 $160 15 $180 18 $200 17 $220 16 $211 19 20 21 22 23 24 26 26 50 $ Saas $350 Sher P-pirin Rows 200 Columns 16 15) Table Font Size A A Table Outline 28 29 30 1 pt = Outline table namna Gridlines RE TE = Alternating Row Color Row & Column Size Height 15 pt Fit Width 105 pt Fit 91% + ul Chart T Text co Collaborate View Zoom Add Category Insert Table Shape Media Comment O Format Organize Text Arrange + Q1 Q2 Table Cell A 3 C D E F G H 1 L N Number of put options 2 Exercise price 165 155 Put prke 58.54 $2.19 1000 1000 4 CI Profit on streky 1 llormula Profit on Strategy 2 Bowl formu Prufiton llum Profit of Bear Put Spread 64 Table Styles 53 Headers & Footer HOC MO TO 31 Table Name 5 Stock proe at expiration, in 3 inds G $ $20 8 $40 $30 10 $5. 11 $100 12 $1211 13 $140 14 $160 15 $180 18 $200 17 $220 16 $211 19 20 21 22 23 24 26 26 50 $ Saas $350 Sher P-pirin Rows 200 Columns 16 15) Table Font Size A A Table Outline 28 29 30 1 pt = Outline table namna Gridlines RE TE = Alternating Row Color Row & Column Size Height 15 pt Fit Width 105 pt FitStep by Step Solution
There are 3 Steps involved in it
Step: 1

Get Instant Access to Expert-Tailored Solutions
See step-by-step solutions with expert insights and AI powered tools for academic success
Step: 2

Step: 3
Ace Your Homework with AI
Get the answers you need in no time with our AI-driven, step-by-step assistance
Get Started
Financial management theory and practice
Authors: Eugene F. Brigham and Michael C. Ehrhardt
13th edition
1439078106, 111197375X, 9781439078105, 9781111973759, 978-1439078099