Answered step by step
Verified Expert Solution
Link Copied!

Question

1 Approved Answer

Q2B How to plot the graphs? SKUs Average weekly sales Average price Average feature intensity Tropicana 64oz 4.42 1.99 0.24 Tropicana 96oz 3.47 3.34 0.32

Q2B How to plot the graphs?image text in transcribedimage text in transcribed
SKUs

Average weekly sales

Average price

Average feature intensity

Tropicana 64oz

4.42

1.99

0.24

Tropicana 96oz

3.47

3.34

0.32

Florida National 64oz

2.53

1.51

0.11

Minute Maid 64oz

3.47

1.51

0.15

Minute Maid 96oz

1.62

3.33

0.21

Citrus Hill 64oz

1.36

1.96

0.12

Citrus Hill 96oz

0.64

3.34

0.14

Tropical Fresh 64oz

0.70

1.98

0.18

Florida Gold 64oz

0.50

1.50

0.07

Store Brand 64oz

0.85

1.50

0.85

Store Brand 128oz

0.53

3.00

0.21

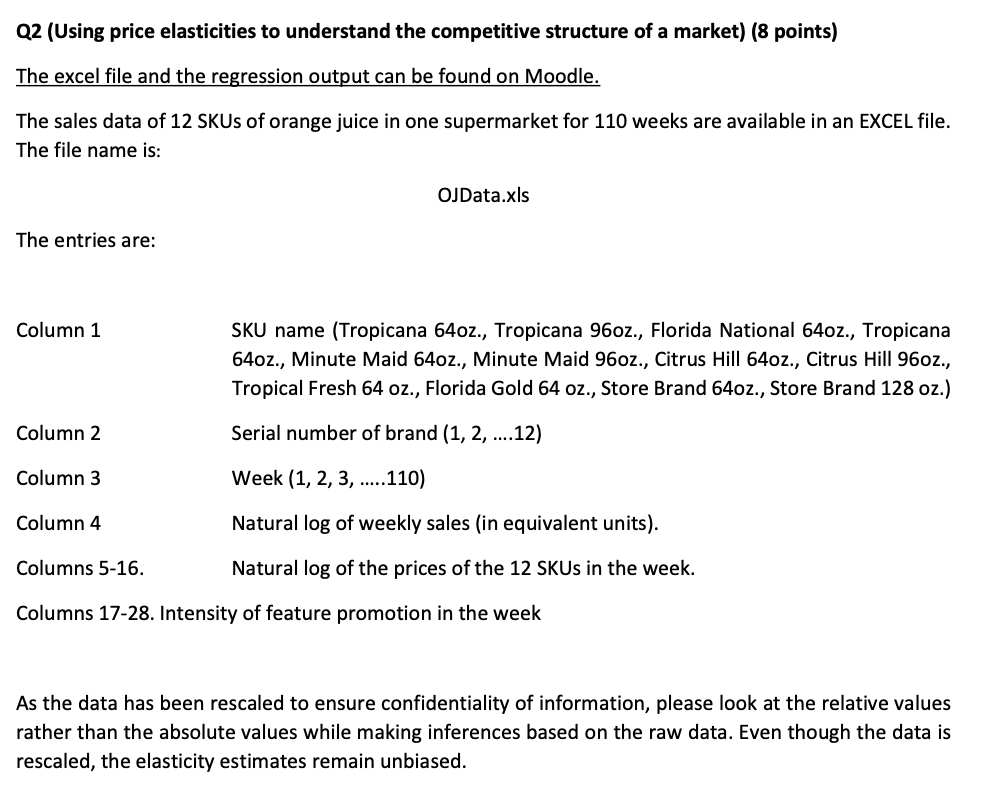
Q2 (Using price elasticities to understand the competitive structure of a market) (8 points) The excel file and the regression output can be found on Moodle. The sales data of 12 SKUs of orange juice in one supermarket for 110 weeks are available in an EXCEL file. The file name is: OJData.xls The entries are: Column 1 SKU name (Tropicana 64oz., Tropicana 96oz., Florida National 64oz., Tropicana 64oz., Minute Maid 64oz., Minute Maid 96oz., Citrus Hill 64oz., Citrus Hill 96oz., Tropical Fresh 64 oz., Florida Gold 64 oz., Store Brand 64oz., Store Brand 128 oz.) Column 2 Serial number of brand (1,2,.12) Column 3 Week (1,2,3,..110) Column 4 Natural log of weekly sales (in equivalent units). Columns 5-16. Natural log of the prices of the 12 SKUs in the week. Columns 17-28. Intensity of feature promotion in the week As the data has been rescaled to ensure confidentiality of information, please look at the relative values rather than the absolute values while making inferences based on the raw data. Even though the data is rescaled, the elasticity estimates remain unbiased. (b) Plot ln (sales) against ln (price) for each of the 12 SKUs. Please state in a few sentences what you are able to learn from a visual analysis of the 12 graphs. (1.5 points)

Step by Step Solution

There are 3 Steps involved in it

Step: 1

blur-text-image

Get Instant Access to Expert-Tailored Solutions

See step-by-step solutions with expert insights and AI powered tools for academic success

Step: 2

blur-text-image

Step: 3

blur-text-image

Ace Your Homework with AI

Get the answers you need in no time with our AI-driven, step-by-step assistance

Get Started

Recommended Textbook for

Essentials of Management

Authors: Andrew J. DuBrin

9th Edition

538478233, 2900538478235, 978-0538478236

More Books

Students also viewed these General Management questions