

Answered step by step
Verified Expert Solution
Question
1 Approved Answer
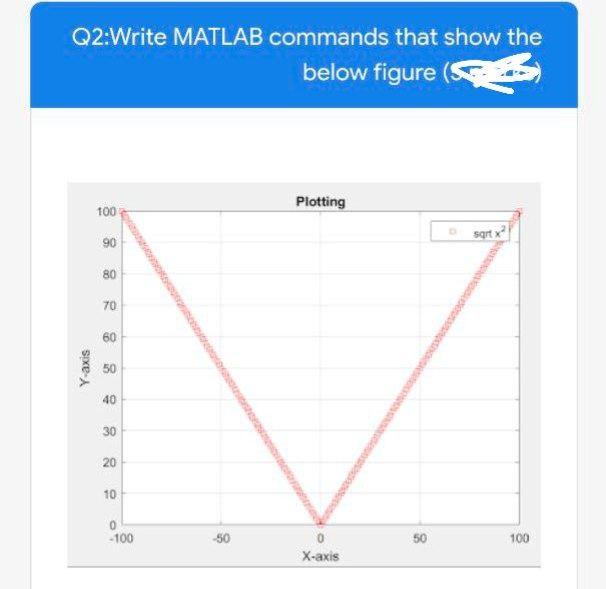
Q2:Write MATLAB commands that show the below figure (SFS Plotting 100 90 Sort x? 80 70 60 Y-axis 50 40 30 20 10 0 -100
Step by Step Solution
There are 3 Steps involved in it
Step: 1

Get Instant Access to Expert-Tailored Solutions
See step-by-step solutions with expert insights and AI powered tools for academic success
Step: 2

Step: 3
Ace Your Homework with AI
Get the answers you need in no time with our AI-driven, step-by-step assistance
Get Started
Optimizing Data Collection In Warzones
Authors: Aaget Aamber
1st Edition
B0CQRRFP5F, 979-8869065902