

Question
Q3 a)Analyze the following Graph and the breakeven point and discuss how this analysis is used for decision making? b) I f fixed costs are
Q3
a)Analyze the following Graph and the breakeven point and discuss how this analysis is used for decision making?
b)If fixed costs are $400,000, selling price per unit is $150, and variable cost per unit is $100, how many units must the company sell in order to earn a profit of $ 100,000?
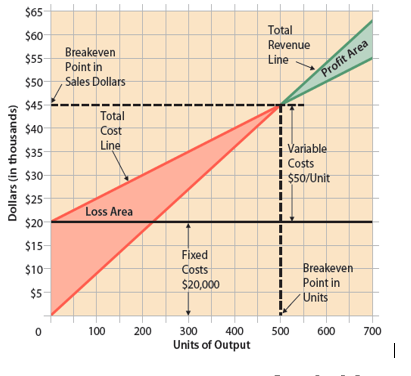
$65 $60 $55 $50 Breakeven Point in Sales Dollars Total Revenue Line Profit Area $45 1 $40 Total Cost Line $35 Dollars (in thousands) Variable I Costs $50/Unit $30 $25 Loss Area $20 $15 $10 $5 Fixed Costs $20,000 Breakeven Point in Units 0 100 200 500 600 700 300 400 Units of Output |
Step by Step Solution
There are 3 Steps involved in it
Step: 1

Get Instant Access to Expert-Tailored Solutions
See step-by-step solutions with expert insights and AI powered tools for academic success
Step: 2

Step: 3
Ace Your Homework with AI
Get the answers you need in no time with our AI-driven, step-by-step assistance
Get Started
Auditing Security And Controls Of Windows Active Directory Domains
Authors: Derek Melber
1st Edition
0894135635, 978-0894135637