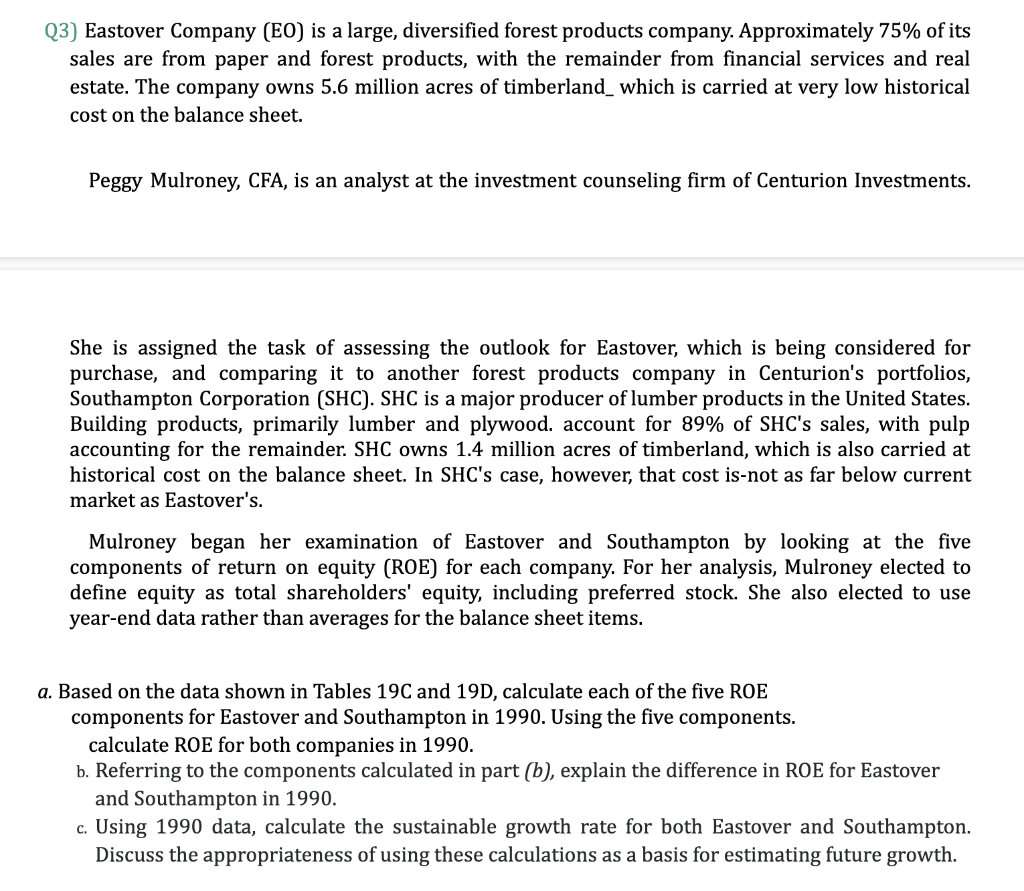
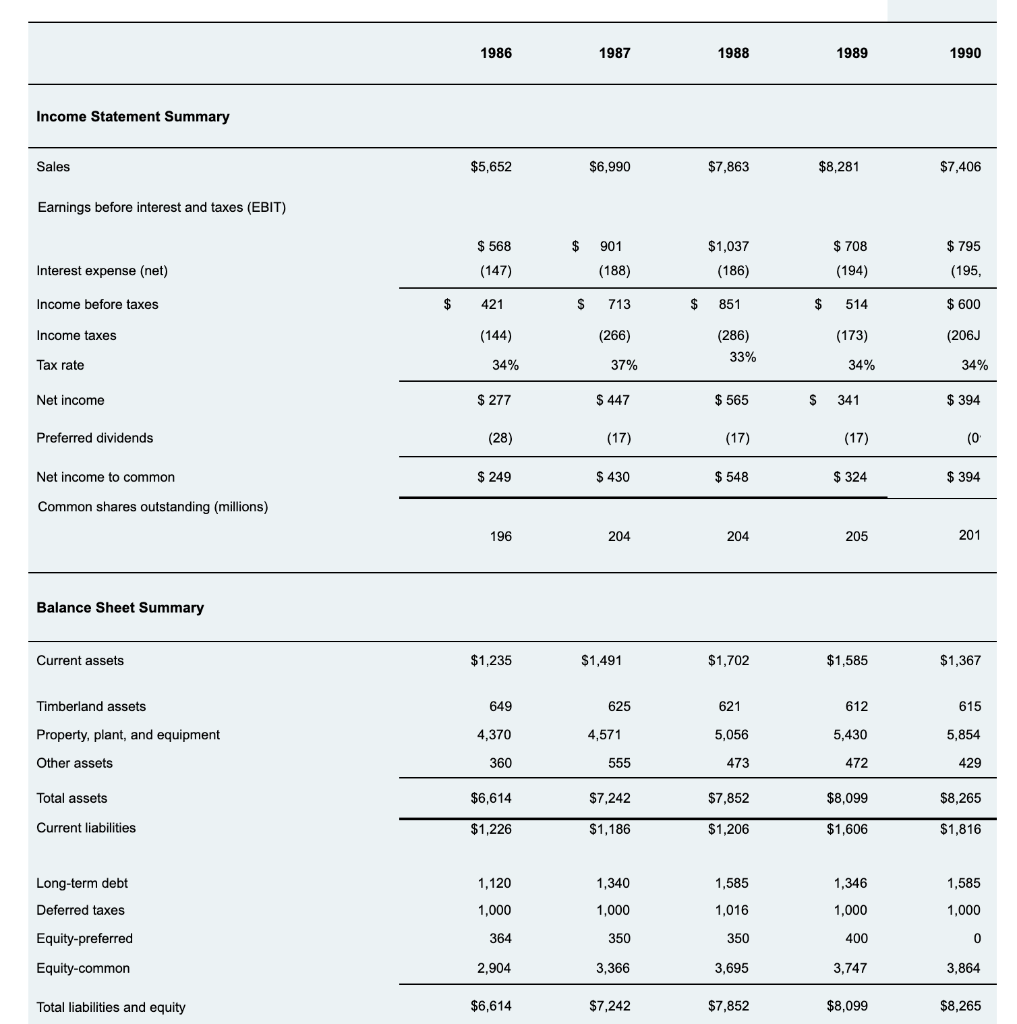
Q3) Eastover Company (E0) is a large, diversified forest products company. Approximately 75% of its sales are from paper and forest products, with the remainder from financial services and real estate. The company owns 5.6 million acres of timberland_ which is carried at very low historical cost on the balance sheet. Peggy Mulroney, CFA, is an analyst at the investment counseling firm of Centurion Investments. She is assigned the task of assessing the outlook for Eastover, which is being considered for purchase, and comparing it to another forest products company in Centurion's portfolios, Southampton Corporation (SHC). SHC is a major producer of lumber products in the United States. Building products, primarily lumber and plywood. account for 89% of SHC's sales, with pulp accounting for the remainder. SHC owns 1.4 million acres of timberland, which is also carried at historical cost on the balance sheet. In SHC's case, however, that cost is-not as far below current market as Eastover's. Mulroney began her examination of Eastover and Southampton by looking at the five components of return on equity (ROE) for each company. For her analysis, Mulroney elected to define equity as total shareholders' equity, including preferred stock. She also elected to use year-end data rather than averages for the balance sheet items. a. Based on the data shown in Tables 19C and 19D, calculate each of the five ROE components for Eastover and Southampton in 1990. Using the five components. calculate ROE for both companies in 1990. b. Referring to the components calculated in part (b), explain the difference in ROE for Eastover and Southampton in 1990. c. Using 1990 data, calculate the sustainable growth rate for both Eastover and Southampton. Discuss the appropriateness of using these calculations as a basis for estimating future growth. 1986 1987 1988 1989 1990 Income Statement Summary Sales $5,652 $6,990 $7,863 $8,281 $7,406 Earnings before interest and taxes (EBIT) $ 568 $ 901 $1,037 $ 708 $ 795 Interest expense (net) (147) (188) (186) (194) (195, Income before taxes $ 421 $ 713 $ 851 $ 514 $ 600 Income taxes (144) (266) (173) (206J (286) 33% Tax rate 34% 37% 34% 34% Net income $ 277 $ 447 $ 565 $ 341 $ 394 Preferred dividends (28) (17) (17) (17) (0 Net income to common $ 249 $ 430 $ 548 $ 324 $ 394 Common shares outstanding (millions) 196 204 204 205 201 Balance Sheet Summary Current assets $1,235 $1,491 $1,702 $1,585 $1,367 Timberland assets 649 625 621 612 615 Property, plant, and equipment 4,370 4,571 5,056 5,430 5,854 Other assets 360 555 473 472 429 Total assets $6,614 $7,242 $7,852 $8,099 $8,265 Current liabilities $1,226 $1,186 $1,206 $1,606 $1,816 Long-term debt 1,120 1,340 1,585 1,346 1,585 Deferred taxes 1,000 1,000 1,016 1,000 1,000 364 350 350 400 0 Equity-preferred Equity-common 2,904 3,366 3,695 3,747 3,864 Total liabilities and equity $6,614 $7,242 $7,852 $8,099 $8,265 Q3) Eastover Company (E0) is a large, diversified forest products company. Approximately 75% of its sales are from paper and forest products, with the remainder from financial services and real estate. The company owns 5.6 million acres of timberland_ which is carried at very low historical cost on the balance sheet. Peggy Mulroney, CFA, is an analyst at the investment counseling firm of Centurion Investments. She is assigned the task of assessing the outlook for Eastover, which is being considered for purchase, and comparing it to another forest products company in Centurion's portfolios, Southampton Corporation (SHC). SHC is a major producer of lumber products in the United States. Building products, primarily lumber and plywood. account for 89% of SHC's sales, with pulp accounting for the remainder. SHC owns 1.4 million acres of timberland, which is also carried at historical cost on the balance sheet. In SHC's case, however, that cost is-not as far below current market as Eastover's. Mulroney began her examination of Eastover and Southampton by looking at the five components of return on equity (ROE) for each company. For her analysis, Mulroney elected to define equity as total shareholders' equity, including preferred stock. She also elected to use year-end data rather than averages for the balance sheet items. a. Based on the data shown in Tables 19C and 19D, calculate each of the five ROE components for Eastover and Southampton in 1990. Using the five components. calculate ROE for both companies in 1990. b. Referring to the components calculated in part (b), explain the difference in ROE for Eastover and Southampton in 1990. c. Using 1990 data, calculate the sustainable growth rate for both Eastover and Southampton. Discuss the appropriateness of using these calculations as a basis for estimating future growth. 1986 1987 1988 1989 1990 Income Statement Summary Sales $5,652 $6,990 $7,863 $8,281 $7,406 Earnings before interest and taxes (EBIT) $ 568 $ 901 $1,037 $ 708 $ 795 Interest expense (net) (147) (188) (186) (194) (195, Income before taxes $ 421 $ 713 $ 851 $ 514 $ 600 Income taxes (144) (266) (173) (206J (286) 33% Tax rate 34% 37% 34% 34% Net income $ 277 $ 447 $ 565 $ 341 $ 394 Preferred dividends (28) (17) (17) (17) (0 Net income to common $ 249 $ 430 $ 548 $ 324 $ 394 Common shares outstanding (millions) 196 204 204 205 201 Balance Sheet Summary Current assets $1,235 $1,491 $1,702 $1,585 $1,367 Timberland assets 649 625 621 612 615 Property, plant, and equipment 4,370 4,571 5,056 5,430 5,854 Other assets 360 555 473 472 429 Total assets $6,614 $7,242 $7,852 $8,099 $8,265 Current liabilities $1,226 $1,186 $1,206 $1,606 $1,816 Long-term debt 1,120 1,340 1,585 1,346 1,585 Deferred taxes 1,000 1,000 1,016 1,000 1,000 364 350 350 400 0 Equity-preferred Equity-common 2,904 3,366 3,695 3,747 3,864 Total liabilities and equity $6,614 $7,242 $7,852 $8,099 $8,265