Answered step by step
Verified Expert Solution
Link Copied!

Question

1 Approved Answer

Q3 Given the following 5-dist figure for a data set. The figure is obtained by applying DBSCAN on the data with MinPts =5 and
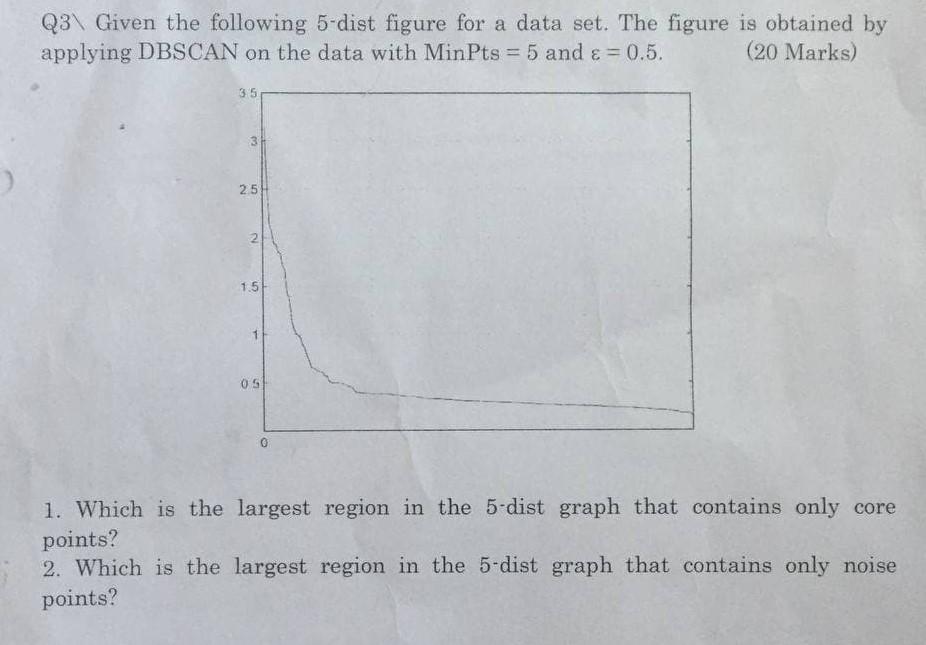
image text in transcribed

Q3 \ Given the following 5-dist figure for a data set. The figure is obtained by applying DBSCAN on the data with MinPts =5 and =0.5. (20 Marks) 1. Which is the largest region in the 5-dist graph that contains only core points? 2. Which is the largest region in the 5-dist graph that contains only noise points

Step by Step Solution

There are 3 Steps involved in it

Step: 1

blur-text-image

Get Instant Access to Expert-Tailored Solutions

See step-by-step solutions with expert insights and AI powered tools for academic success

Step: 2

blur-text-image_2

Step: 3

blur-text-image_3

Ace Your Homework with AI

Get the answers you need in no time with our AI-driven, step-by-step assistance

Get Started

Recommended Textbook for

Deductive And Object Oriented Databases Second International Conference Dood 91 Munich Germany December 18 1991 Proceedings Lncs 566

Authors: Claude Delobel ,Michael Kifer ,Yoshifumi Masunaga

1st Edition

3540550151, 978-3540550150

More Books

Students also viewed these Databases questions

Question

What is SQL? How is it used to query a database?

Answered: 1 week ago

Question

Explain the importance of nonverbal messages.

Answered: 1 week ago

Question

Describe the advantages of effective listening.

Answered: 1 week ago

Question

Prepare an employment application.

Answered: 1 week ago