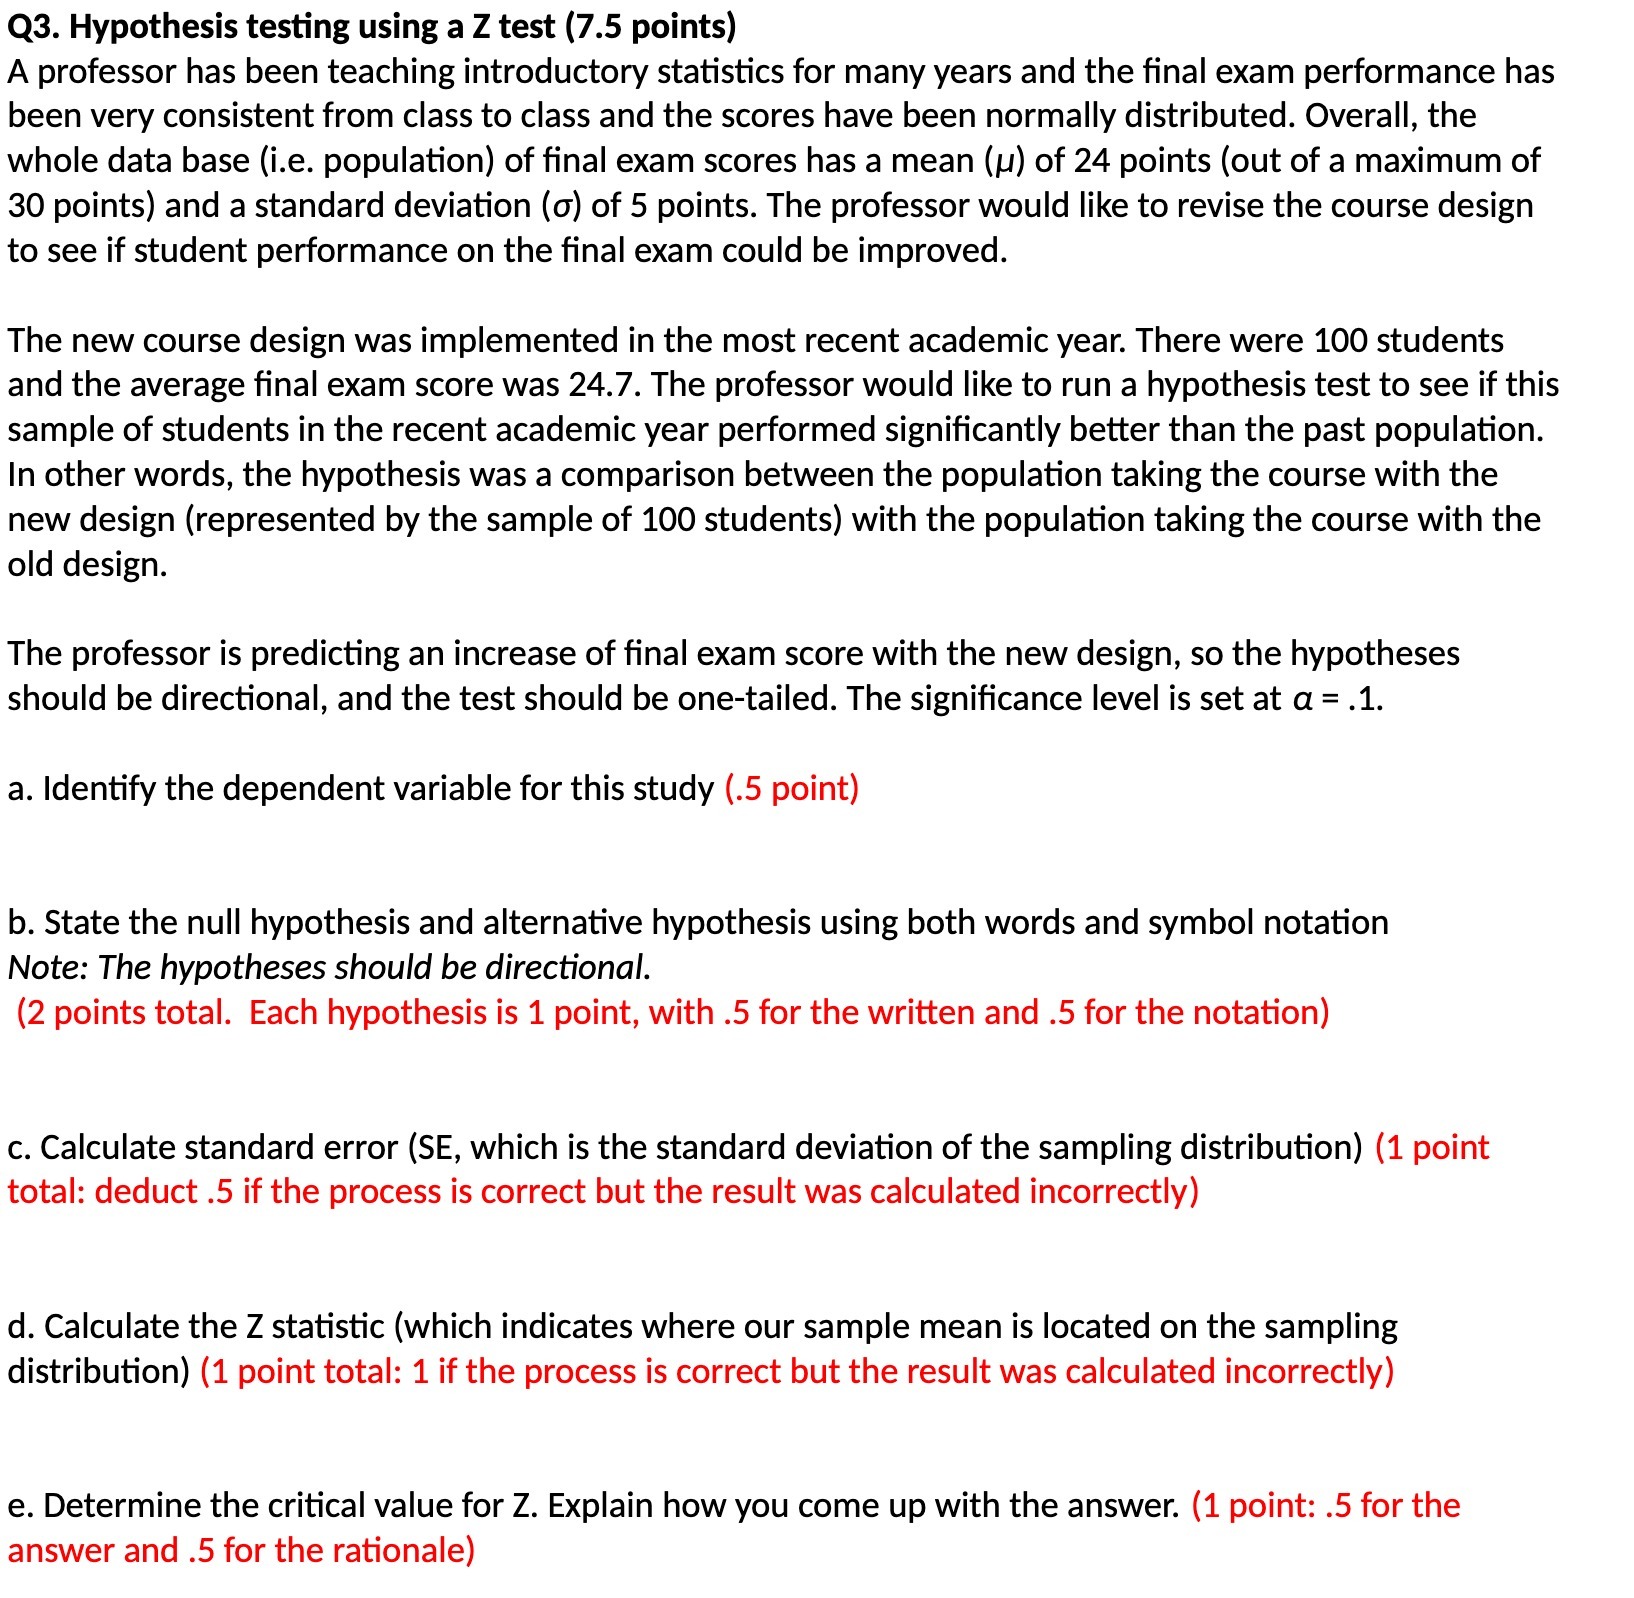
Q3. Hypothesis testing using a Z test (7.5 points) A professor has been teaching introductory statistics for many years and the nal exam performance has been very consistent from class to class and the scores have been normally distributed. Overall, the whole data base (i.e. population) of nal exam scores has a mean (u) of 24 points (out of a maximum of 30 points) and a standard deviation (0) of 5 points. The professor would like to revise the course design to see if student performance on the nal exam could be improved. The new course design was implemented in the most recent academic year. There were 100 students and the average nal exam score was 24.7. The professor would like to run a hypothesis test to see if this sample of students in the recent academic year performed signicantly better than the past population. In other words, the hypothesis was a comparison between the population taking the course with the new design (represented by the sample of 100 students) with the population taking the course with the old design. The professor is predicting an increase of nal exam score with the new design, so the hypotheses should be directional, and the test should be one-tailed. The signicance level is set at a = .1. a. Identify the dependent variable for this study (.5 point) b. State the null hypothesis and alternative hypothesis using both words and symbol notation Note: The hypotheses should be directional. (2 points total. Each hypothesis is 1 point, with .5 for the written and .5 for the notation) c. Calculate standard error (SE, which is the standard deviation of the sampling distribution) (1 point total: deduct .5 if the process is correct but the result was calculated incorrectly) d. Calculate the 2 statistic (which indicates where our sample mean is located on the sampling distribution) (1 point total: 1 if the process is correct but the result was calculated incorrectly) e. Determine the critical value for 2. Explain how you come up with the answer. (1 point: .5 for the answer and .5 for the rationale)