Q3: Please help me with a b and c
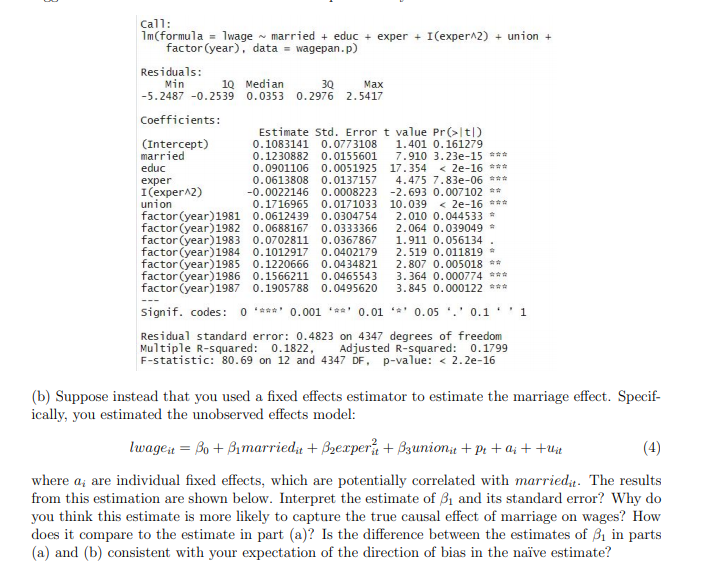
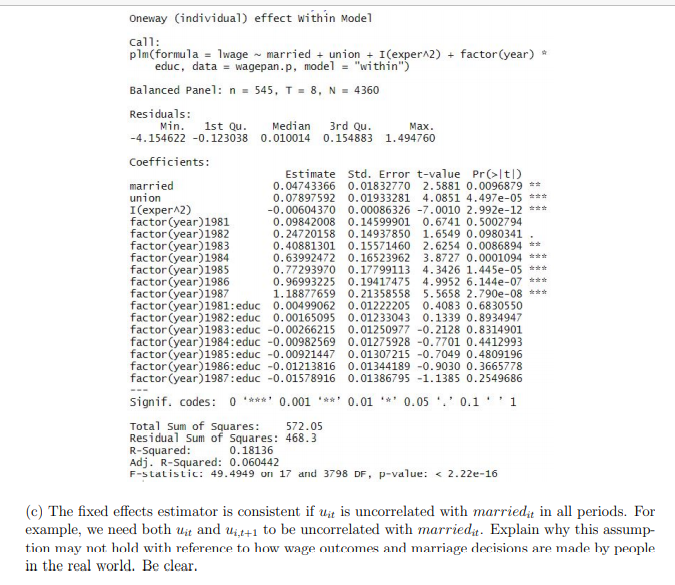
3. Suppose we were interested in using the Vella and Verbeek (1998) panel dataset, described on slide #20 of secton3(1], to estimate the causal effect of marriage on men's wage rates. (a) We begin by using the OLS estimator to estimate the parameters of the model: images = 343 + lmred + zedm + 63:33pm}: + ,846Ipff'i + lawman\" + \"pr + U11 (3] where p! are xed year effects, which we identify by including a set of year dummy variables. The results from this regression are shown below. Interpret the estimate of ,8] and its statistical signicance. What do you think might explain this result? 1Why might you be wary of giving the estimate a causal interpretation? Do you think that the true e'ect of marriage is more likely to be bigger or smaller than this naive estimate? Explain clearly. Call: 1m(formula = ]wage ~ married + educ + exper + I(exper^2) + union + factor (year), data = wagepan.p) Residuals: Min 10 Median Max -5.2487 -0.2539 0.0353 0.2976 2.5417 Coefficients: Estimate Std. Error t value Pr(>|t/) (Intercept) 0. 1083141 0. 0773108 1. 401 0. 161279 married 0. 1230882 0. 0155601 7. 910 3.23e-15 # # # educ 0. 0901106 0. 0051925 17. 354 |t[) married 0. 04743366 0. 01832770 2. 5881 0. 0096879 # union 0. 07897592 0. 01933281 4. 0851 4.497e-05 *# # I (experA2) -0. 00604370 0. 00086326 -7. 0010 2.992e-12 *# # factor (year) 1981 0. 09842008 0. 14599901 0. 6741 0. 5002794 factor (year) 1982 0. 24720158 0. 14937850 1. 6549 0.0980341 factor (year) 1983 0. 40881301 0. 15571460 2. 6254 0.0086894 +# factor (year) 1984 0. 63992472 0. 16523962 3.8727 0.0001094 *# # factor (year) 1985 0.77293970 0. 17799113 4. 3426 1.445e-05 *## factor (year) 1986 0. 96993225 0. 19417475 4.9952 6.144e-07 + factor (year) 1987 1. 18877659 0. 21358558 5. 5658 2.790e-08 *# # factor (year) 1981: educ 0. 00499062 0. 01222205 0. 4083 0.6830550 Factor (year)1982: educ 0. 00165095 0. 01233043 0.1339 0.8934947 factor (year)1983: educ -0. 00266215 0. 01250977 -0.2128 0.8314901 factor (year)1984: educ -0. 00982569 0.01275928 -0.7701 0.4412993 factor (year)1985: educ -0. 00921447 0. 01307215 -0.7049 0.4809196 factor (year)1986: educ -0. 01213816 0.01344189 -0.9030 0.3665778 factor (year)1987: educ -0. 01578916 0. 01386795 -1.1385 0.2549686 Signif. codes: 0 '#*#' 0.001 '*#' 0.01 '*' 0.05 ' . ' 0.1 ' ' 1 Total Sum of Squares: 572.05 Residual Sum of Squares: 468.3 R-Squared: 0. 18136 Adj. R-Squared: 0.060442 F-statistic: 49.4949 on 17 and 3798 DF, p-value:


