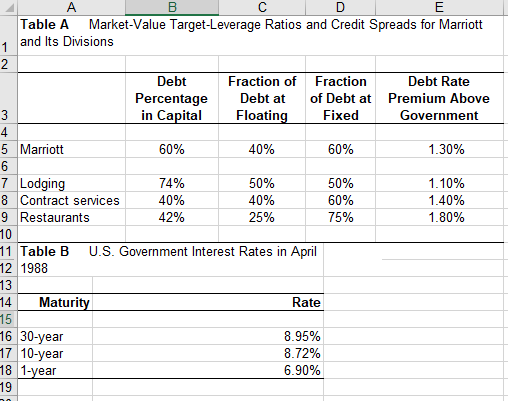
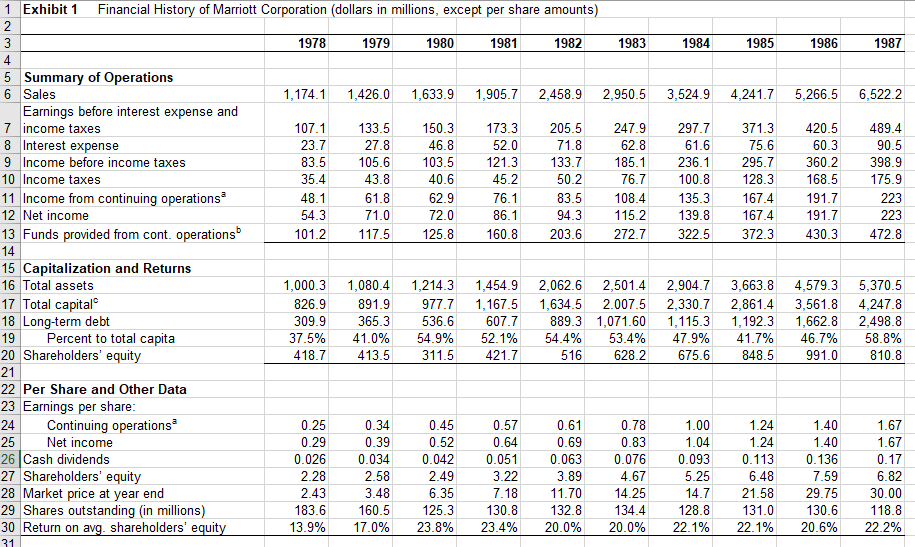
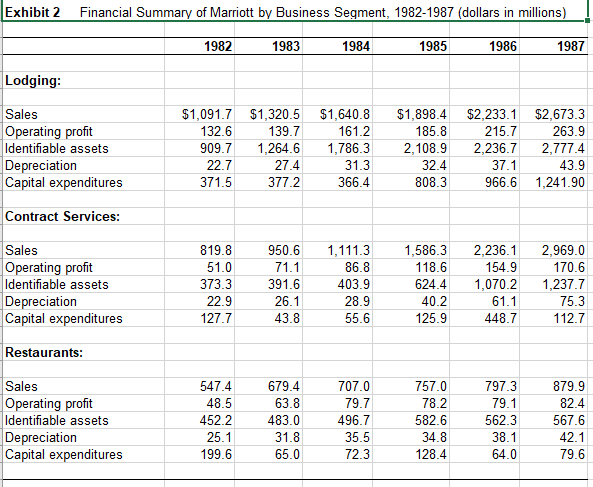
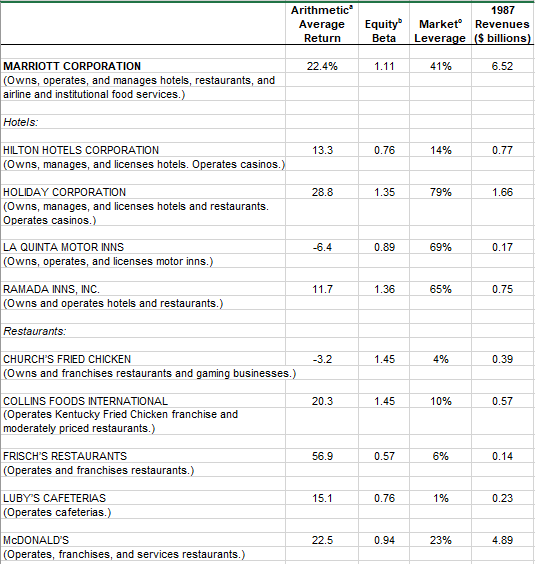
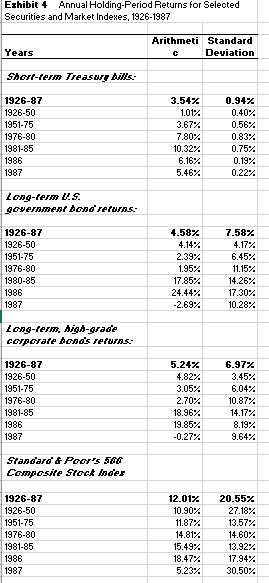
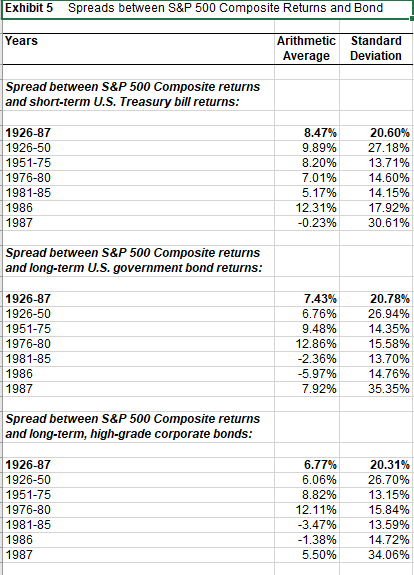
Q3. What is the weighted average cost of capital for Marriott Corporation? What risk-free rate and risk premium did you use to calculate the cost of equity? How did you measure Marriott's cost of debt? Table A Market-Value Target-Leverage Ratios and Credit Spreads for Marriott and Its Divisions Debt Rate Debt Percentage in Capital Fraction of Fraction Premium Above Government of Debt at Fixed Debt at Floatin 1.30% 60% 40% 60% 5 Marriott 1.10% 1.40% 1.80% 5096 60% 7510 50% 40% 25% 74% 40% 42% 7 Lodging 8 Contract services 9 Restaurants 11 Table B U.S. Government Interest Rates in April 12 1988 13 14 Maturi Rate 8.95% 8.72% 6.90% 16 30-year 17 10-year 18 1-year 1 Exhibit 1 Financial History of Marriott Corporation (dollars in millions, except per share amounts) 1986 1980 1984 1978 1979 1981 1982 1983 1985 1987 5 Summary of Operations 6 Sales 1,1741,426.0 1,633.91,905.7 2,458.92,950.53,524.9 4,241.75,266.5 6,522.2 Earnings before interest expense and 7 income taxes 8 Interest expense 9 Income before income taxes 10 Income taxes 11 Income from continuing operations 12 Net income 0733.5150.3173.3 205.5247.9297.7371.3 420.5489.4 90.5 83.505.603.5 121.3 133.785.236295.7 360.2398.9 76.7100.8128.3168.5 175.9 223 23.7 52.0 75.6 60.3 35.4 43.8 40.6 62.9 72.0 45.2 76.1 83.508.435.3167.4 191.7 94.315.239.8167.4 191.7 13 Funds provided from cont. operations 101.27.5125.8160.8203.6 272.7322.5 372.3 430.3472.8 15 Capitalization and Returns 16 Total assets 1,000.31,080.41,214.3 1,454.92,062.6 2,501.42,904.73,663.8 4,579.35,370.5 826.9891.9977.71,167.5 1,634.5 2.007.5 2,330.72,861.4 3,561.8 4,247.8 09.9365.3536.6 6077889.3 1,71.015.31,192.3 1,662.8 2,498.8 37.5% 41.0% 54.9% 52.1% 54.4% 53.4% 47.9% 41.7% 46.7% 58.8% 516 628.2 675.6 848.59910810.8 17 Total capital Long-term debt 19 Percent to total capita 20 Shareholders' equity 418.7 413.5 311.5421.7 22 Per Share and Other Data 23 Earnings per share 24 Continuing operations 0.25 0.29 0.57 0.64 0.051 0.78 1.00 Net income 0.39 0.034 2.58 3.48 0.52 0.042 0.69 1.24 0.113 6.48 26 Cash dividends 27 Shareholders' equity 28 Market price at vear end 29 Shares outstanding (in millions) 0.026 0.063 0.076 4.67 7.18014.25 0.093 0.136 7.59 2.28 5.25 14.721.5829.7530.00 6.35 183.6.525.3130.8 132.834.128.81310130.6 118.8 13.9% 17.0% 23.8% 23.4% 20.0% 20.0% 22.1% 22.1% 20.6% 22.2% on avg. shareholders' eq Exhibit 2 Financial Summary of Marriott by Business Segment, 1982-1987 (dollars in millions) 1984 1982 1983 1985 1986 1987 Lodging $1,091.7$1,320.5 $1,640.8$1,898.4$2,233.1 $2,673.3 215.7263.9 909.71,264.6 1,786.32,108.92,236.7 2,777.4 Sales Operating profit Identifiable assets Depreciation Capital expenditures 139.7 185.8 132.6 161.2 27.4 371.5377.2 31.3 366.4 32.4 808.3 22.7 43.9 966.6 1,241.90 37.1 Contract Services Sales Operating profit Identifiable assets Depreciation Capital expenditures 819.8950.6 1,111.3 1,586.32,236.1 2,969.0 170.6 86.8 403.9 28.9 55.6 154.9 624.41,070.21,237.7 61.1 448.7 118.6 373.3 22.9 127.7 391.6 26.1 43.8 40.2 125.9 75.3 112.7 Restaurants: 797.3879.9 82.4 562.3567.6 42.1 79.6 547.4 48.5 452.2 25.1 199.6 679.4 63.8 483.0 31.8 65.0 707.0 79.7 496.7 35.5 72.3 757.0 78.2 582.6 34.8 128.4 Sales Operating profit Identifiable assets Depreciation Capital expenditures 79.1 38.1 64.0 Arithmetic 1987 AverageEquity MarketRevenues s billions Return Beta Levera 41% MARRIOTT CORPORATION Owns, operates, and manages hotels, restaurants, and airline and institutional food services 22.4% 1.11 6.52 Hotels 13.3 HILTON HOTELS CORPORATION (Own 0.76 14% 0.77 . Operates casinos.) s, manages, and licenses hotels 1.66 HOLIDAY CORPORATION (Owns, manages, and licenses hotels and restaurants Operates casinos.) 28.8 1.35 79% LA QUINTA MOTOR INNS 0.89 69% 0.17 -6.4 (Owns, operates, and licenses motor inns.) RAMADA INNS, INC Owns and operates hotels and restaurants.) 1.36 65% 0.75 Restaurants 4% CHURCH'S FRIED CHICKEN Owns and franchises restaurants and gaming businesses.) 3.2 1.45 0.39 1.45 0.57 COLLINS FOODS INTERNATIONAL (Operates Kentucky Fried Chicken franchise and moderately priced restaurants.) 20.3 10% FRISCH'S RESTAURANTS 56.9 0.57 6% Operates and franchises restaurants.) 196 LUBY'S CAFETERIAS 0.76 0.23 Operates cafeterias.) McDONALD'S Operates, franchises, and services restaurants.) 22.5 0.94 23% 4.89 Erhibit 4 Annual Holding-Period Returns for Selected Securities and Market Indexes, 1926-1987 Arithmeti Standard Deviation Years Short-ferm Ireasu Afts 1926-87 3.54% 1.01% 3.67% 7.80% 10.32% 6.16% 5.46% 0.34% 0.40% 0.56% 0.83% 0.75% 0.19% 0.22% 1926-50 1951-75 1976-80 1981-85 1986 1987 Long-ferm tts. goverament bond returns. 4.58% 4.14% 2.39% 1.95% 17.85% 24.44% -2.69% 7.58% 1926-87 1926-50 1951-75 6.45% 11.15% 14.26% 17.30% 10.28% 1976-80 1980-85 1986 1987 Long-ferm, Aiah-arade corporate bonos reforns. 5.24% 4.82% 3,05% 2.70% 18.96% 19.85% -0.27% 1926-87 6.97% 3.45% 6,04% 10.87% 14.17% 8.19% 9.64% 1926-50 1951-75 1976-80 1981-85 1986 1987 Staaoard & Poor's Composife Stoct iooer 1926-87 1926-50 12.01% 10.90% 11.87% 14.81% 15.49% 18.47% 5.23% 20.55% 27.18% 13.57% 14.60% 13.92% 17.94% 30.50% 1951-75 1976-80 1981-85 1986 1987 Exhibit 5 Spreads between S&P 500 Composite Returns and Bond Years Arithmetic Standard Average Deviation Spread between S&P 500 Composite returns and short-term U.S. Treasury bill returns: 1926-87 1926-50 1951-75 1976-80 1981-85 1986 1987 8.47% 9.89% 8.20% 7.01% 5.17% 12.31% -0.23% 20.60% 27.18% 13.71% 14.60% 14.15% 17.92% 30.61% Spread between S&P 500 Composite returns and long-term U.S. government bond returns: 1926-87 1926-50 1951-75 1976-80 1981-85 1986 1987 7.43% 6.76% 9.48% 12.86% 2.36% -5.97% 7.92% 20.78% 26.94% 14.35% 15.58% 13.70% 14.76% 35.35% Spread between S&P 500 Composite returns and long-term, high-grade corporate bonds 1926-87 1926-50 1951-75 1976-80 1981-85 1986 1987 6 77% 6.06% 8.82% 12.11% 3.47% -1.38% 5.50% 20.31% 26.70% 13.15% 15.84% 13.59% 14.72% 34.06% Q3. What is the weighted average cost of capital for Marriott Corporation? What risk-free rate and risk premium did you use to calculate the cost of equity? How did you measure Marriott's cost of debt? Table A Market-Value Target-Leverage Ratios and Credit Spreads for Marriott and Its Divisions Debt Rate Debt Percentage in Capital Fraction of Fraction Premium Above Government of Debt at Fixed Debt at Floatin 1.30% 60% 40% 60% 5 Marriott 1.10% 1.40% 1.80% 5096 60% 7510 50% 40% 25% 74% 40% 42% 7 Lodging 8 Contract services 9 Restaurants 11 Table B U.S. Government Interest Rates in April 12 1988 13 14 Maturi Rate 8.95% 8.72% 6.90% 16 30-year 17 10-year 18 1-year 1 Exhibit 1 Financial History of Marriott Corporation (dollars in millions, except per share amounts) 1986 1980 1984 1978 1979 1981 1982 1983 1985 1987 5 Summary of Operations 6 Sales 1,1741,426.0 1,633.91,905.7 2,458.92,950.53,524.9 4,241.75,266.5 6,522.2 Earnings before interest expense and 7 income taxes 8 Interest expense 9 Income before income taxes 10 Income taxes 11 Income from continuing operations 12 Net income 0733.5150.3173.3 205.5247.9297.7371.3 420.5489.4 90.5 83.505.603.5 121.3 133.785.236295.7 360.2398.9 76.7100.8128.3168.5 175.9 223 23.7 52.0 75.6 60.3 35.4 43.8 40.6 62.9 72.0 45.2 76.1 83.508.435.3167.4 191.7 94.315.239.8167.4 191.7 13 Funds provided from cont. operations 101.27.5125.8160.8203.6 272.7322.5 372.3 430.3472.8 15 Capitalization and Returns 16 Total assets 1,000.31,080.41,214.3 1,454.92,062.6 2,501.42,904.73,663.8 4,579.35,370.5 826.9891.9977.71,167.5 1,634.5 2.007.5 2,330.72,861.4 3,561.8 4,247.8 09.9365.3536.6 6077889.3 1,71.015.31,192.3 1,662.8 2,498.8 37.5% 41.0% 54.9% 52.1% 54.4% 53.4% 47.9% 41.7% 46.7% 58.8% 516 628.2 675.6 848.59910810.8 17 Total capital Long-term debt 19 Percent to total capita 20 Shareholders' equity 418.7 413.5 311.5421.7 22 Per Share and Other Data 23 Earnings per share 24 Continuing operations 0.25 0.29 0.57 0.64 0.051 0.78 1.00 Net income 0.39 0.034 2.58 3.48 0.52 0.042 0.69 1.24 0.113 6.48 26 Cash dividends 27 Shareholders' equity 28 Market price at vear end 29 Shares outstanding (in millions) 0.026 0.063 0.076 4.67 7.18014.25 0.093 0.136 7.59 2.28 5.25 14.721.5829.7530.00 6.35 183.6.525.3130.8 132.834.128.81310130.6 118.8 13.9% 17.0% 23.8% 23.4% 20.0% 20.0% 22.1% 22.1% 20.6% 22.2% on avg. shareholders' eq Exhibit 2 Financial Summary of Marriott by Business Segment, 1982-1987 (dollars in millions) 1984 1982 1983 1985 1986 1987 Lodging $1,091.7$1,320.5 $1,640.8$1,898.4$2,233.1 $2,673.3 215.7263.9 909.71,264.6 1,786.32,108.92,236.7 2,777.4 Sales Operating profit Identifiable assets Depreciation Capital expenditures 139.7 185.8 132.6 161.2 27.4 371.5377.2 31.3 366.4 32.4 808.3 22.7 43.9 966.6 1,241.90 37.1 Contract Services Sales Operating profit Identifiable assets Depreciation Capital expenditures 819.8950.6 1,111.3 1,586.32,236.1 2,969.0 170.6 86.8 403.9 28.9 55.6 154.9 624.41,070.21,237.7 61.1 448.7 118.6 373.3 22.9 127.7 391.6 26.1 43.8 40.2 125.9 75.3 112.7 Restaurants: 797.3879.9 82.4 562.3567.6 42.1 79.6 547.4 48.5 452.2 25.1 199.6 679.4 63.8 483.0 31.8 65.0 707.0 79.7 496.7 35.5 72.3 757.0 78.2 582.6 34.8 128.4 Sales Operating profit Identifiable assets Depreciation Capital expenditures 79.1 38.1 64.0 Arithmetic 1987 AverageEquity MarketRevenues s billions Return Beta Levera 41% MARRIOTT CORPORATION Owns, operates, and manages hotels, restaurants, and airline and institutional food services 22.4% 1.11 6.52 Hotels 13.3 HILTON HOTELS CORPORATION (Own 0.76 14% 0.77 . Operates casinos.) s, manages, and licenses hotels 1.66 HOLIDAY CORPORATION (Owns, manages, and licenses hotels and restaurants Operates casinos.) 28.8 1.35 79% LA QUINTA MOTOR INNS 0.89 69% 0.17 -6.4 (Owns, operates, and licenses motor inns.) RAMADA INNS, INC Owns and operates hotels and restaurants.) 1.36 65% 0.75 Restaurants 4% CHURCH'S FRIED CHICKEN Owns and franchises restaurants and gaming businesses.) 3.2 1.45 0.39 1.45 0.57 COLLINS FOODS INTERNATIONAL (Operates Kentucky Fried Chicken franchise and moderately priced restaurants.) 20.3 10% FRISCH'S RESTAURANTS 56.9 0.57 6% Operates and franchises restaurants.) 196 LUBY'S CAFETERIAS 0.76 0.23 Operates cafeterias.) McDONALD'S Operates, franchises, and services restaurants.) 22.5 0.94 23% 4.89 Erhibit 4 Annual Holding-Period Returns for Selected Securities and Market Indexes, 1926-1987 Arithmeti Standard Deviation Years Short-ferm Ireasu Afts 1926-87 3.54% 1.01% 3.67% 7.80% 10.32% 6.16% 5.46% 0.34% 0.40% 0.56% 0.83% 0.75% 0.19% 0.22% 1926-50 1951-75 1976-80 1981-85 1986 1987 Long-ferm tts. goverament bond returns. 4.58% 4.14% 2.39% 1.95% 17.85% 24.44% -2.69% 7.58% 1926-87 1926-50 1951-75 6.45% 11.15% 14.26% 17.30% 10.28% 1976-80 1980-85 1986 1987 Long-ferm, Aiah-arade corporate bonos reforns. 5.24% 4.82% 3,05% 2.70% 18.96% 19.85% -0.27% 1926-87 6.97% 3.45% 6,04% 10.87% 14.17% 8.19% 9.64% 1926-50 1951-75 1976-80 1981-85 1986 1987 Staaoard & Poor's Composife Stoct iooer 1926-87 1926-50 12.01% 10.90% 11.87% 14.81% 15.49% 18.47% 5.23% 20.55% 27.18% 13.57% 14.60% 13.92% 17.94% 30.50% 1951-75 1976-80 1981-85 1986 1987 Exhibit 5 Spreads between S&P 500 Composite Returns and Bond Years Arithmetic Standard Average Deviation Spread between S&P 500 Composite returns and short-term U.S. Treasury bill returns: 1926-87 1926-50 1951-75 1976-80 1981-85 1986 1987 8.47% 9.89% 8.20% 7.01% 5.17% 12.31% -0.23% 20.60% 27.18% 13.71% 14.60% 14.15% 17.92% 30.61% Spread between S&P 500 Composite returns and long-term U.S. government bond returns: 1926-87 1926-50 1951-75 1976-80 1981-85 1986 1987 7.43% 6.76% 9.48% 12.86% 2.36% -5.97% 7.92% 20.78% 26.94% 14.35% 15.58% 13.70% 14.76% 35.35% Spread between S&P 500 Composite returns and long-term, high-grade corporate bonds 1926-87 1926-50 1951-75 1976-80 1981-85 1986 1987 6 77% 6.06% 8.82% 12.11% 3.47% -1.38% 5.50% 20.31% 26.70% 13.15% 15.84% 13.59% 14.72% 34.06%


