

Question: Q3 What is wrong in figure 2. Fig 2 T= 290 K T= 210 K T= 230 K V
Q3 What is wrong in figure 2.
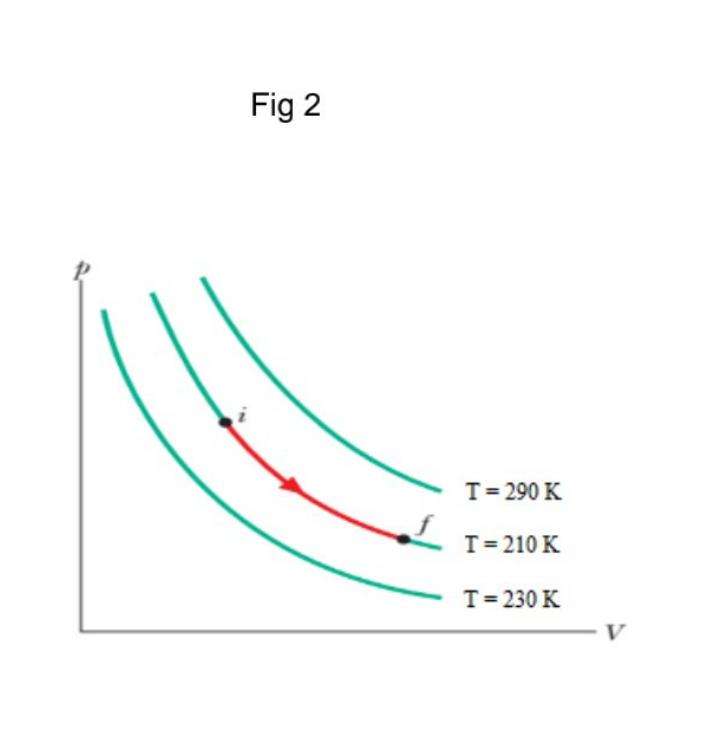
Fig 2 T= 290 K T= 210 K T= 230 K V
Step by Step Solution
★★★★★
3.48 Rating (155 Votes )
There are 3 Steps involved in it
1 Expert Approved Answer
Step: 1 Unlock

Solution In the graph isotherms are shown which means each curve shows the relationship betw... View full answer
Question Has Been Solved by an Expert!
Get step-by-step solutions from verified subject matter experts
Step: 2 Unlock
Step: 3 Unlock
Document Format (2 attachments)
63655e270f614_240249.pdf
180 KBs PDF File
63655e270f614_240249.docx
120 KBs Word File