

Answered step by step
Verified Expert Solution
Question
1 Approved Answer
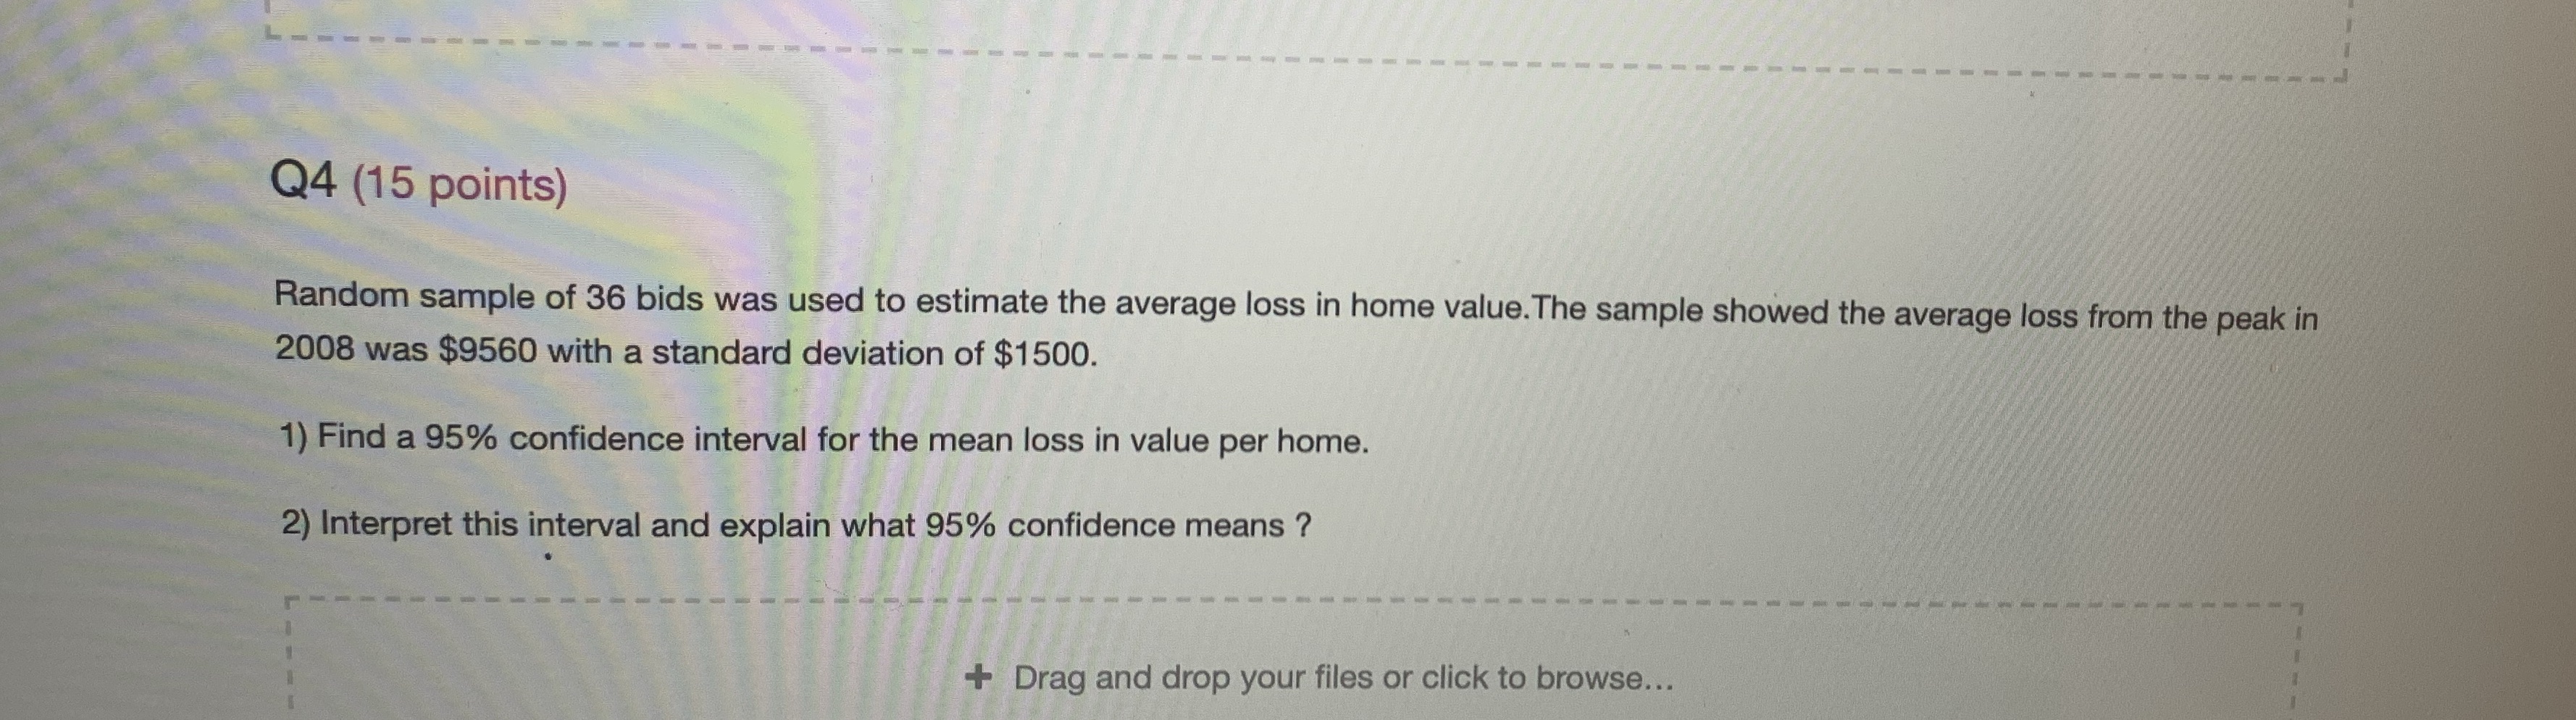
Q4 (15 points) Random sample of 36 bids was used to estimate the average loss in home value. The sample showed the average loss from
Step by Step Solution
There are 3 Steps involved in it
Step: 1

Get Instant Access to Expert-Tailored Solutions
See step-by-step solutions with expert insights and AI powered tools for academic success
Step: 2

Step: 3
Ace Your Homework with AI
Get the answers you need in no time with our AI-driven, step-by-step assistance
Get Started
Contemporary Business Mathematics With Canadian Applications
Authors: Ali R. Hassanlou, S. A. Hummelbrunner, Kelly Halliday
12th Edition
0135285011, 978-0135285015