Q4 and Q5 are telated to each other pleas solve it
thank you

you have to answer it by the order of the pic so you dobt say that is a missing info (its a related to each other )

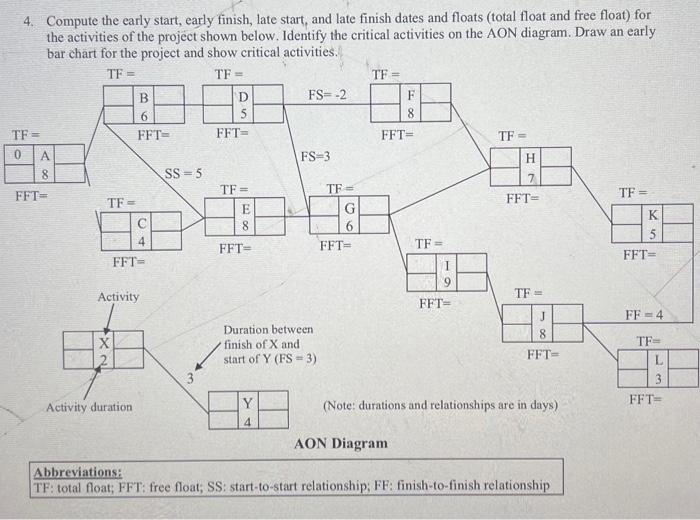
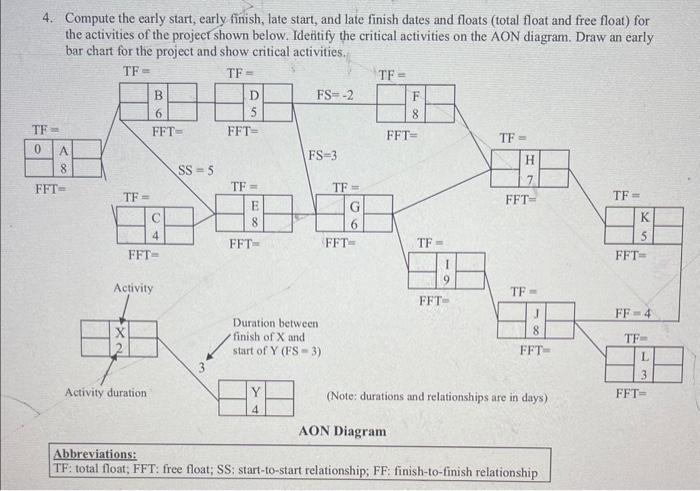
5. Using Microsoft Project software, setup a new project file and enter the data of problem 4 , then: a. Print the project's Gantt (bar) chart and show critical activities with different color and pattern. Put the duration of each activity on the right side of its bar and its name in the left side. b. In the task-pane, show columns for activity names, durations, start times, predecessors, total floats, and free floats. c. Start all activities as late as possible, print the resulting Gantt (bar) chart, and comment on the result. d. Print the network diagram and, on the network, show tasks' names, durations, start times, finish times, total floats, and free floats. 4. Compute the early start, early finish, late start, and late finish dates and floats (total float and free float) for the activities of the project shown below. Ideitify the critical activities on the AON diagram. Draw an early TF: total float; FFT: free float; SS; start-to-start relationship; FF: finish-to-finish relationship 4. Compute the early start, early finish, late start, and late finish dates and floats (total float and free float) for Using Microsoft Project software, setup a new project file and enter the data of problem 4 , then: a. Print the project's Gantt (bar) chart and show critical activities with different color and pattern. Put the duration of each activity on the right side of its bar and its name in the left side. b. In the task-pane, show columns for activity names, durations, start times, predecessors, total floats, and free floats. c. Start all activities as late as possible, print the resulting Gantt (bar) chart, and comment on the result. d. Print the network diagram and, on the network, show tasks' names, durations, start times, finish times, total floats, and free floats. 5. Using Microsoft Project software, setup a new project file and enter the data of problem 4 , then: a. Print the project's Gantt (bar) chart and show critical activities with different color and pattern. Put the duration of each activity on the right side of its bar and its name in the left side. b. In the task-pane, show columns for activity names, durations, start times, predecessors, total floats, and free floats. c. Start all activities as late as possible, print the resulting Gantt (bar) chart, and comment on the result. d. Print the network diagram and, on the network, show tasks' names, durations, start times, finish times, total floats, and free floats. 4. Compute the early start, early finish, late start, and late finish dates and floats (total float and free float) for the activities of the project shown below. Ideitify the critical activities on the AON diagram. Draw an early TF: total float; FFT: free float; SS; start-to-start relationship; FF: finish-to-finish relationship 4. Compute the early start, early finish, late start, and late finish dates and floats (total float and free float) for Using Microsoft Project software, setup a new project file and enter the data of problem 4 , then: a. Print the project's Gantt (bar) chart and show critical activities with different color and pattern. Put the duration of each activity on the right side of its bar and its name in the left side. b. In the task-pane, show columns for activity names, durations, start times, predecessors, total floats, and free floats. c. Start all activities as late as possible, print the resulting Gantt (bar) chart, and comment on the result. d. Print the network diagram and, on the network, show tasks' names, durations, start times, finish times, total floats, and free floats


