Q4. Can you explain each answer? See attachment
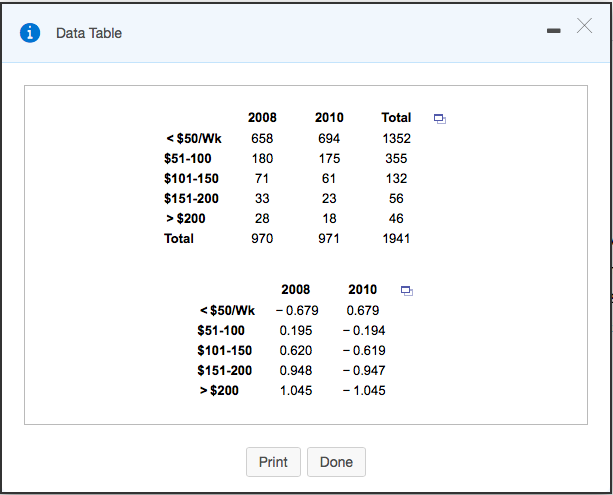
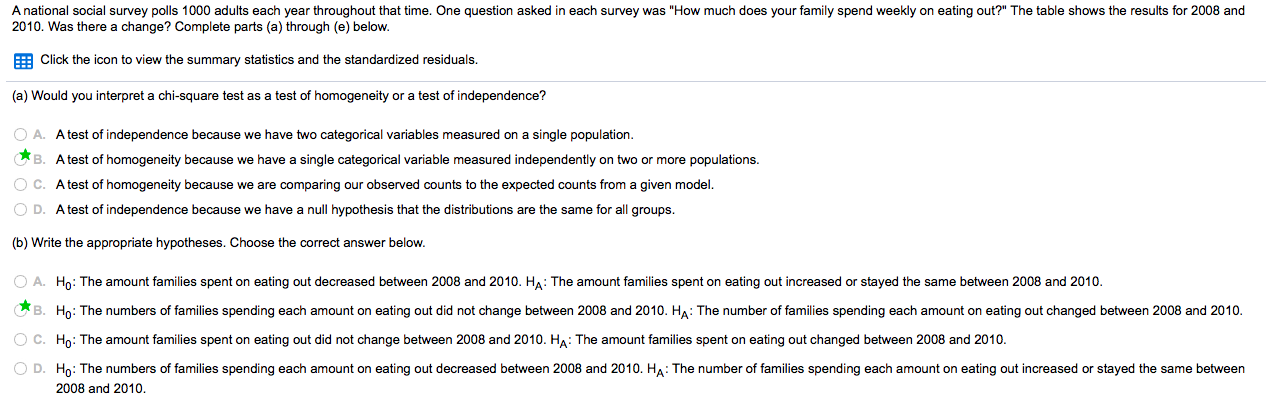
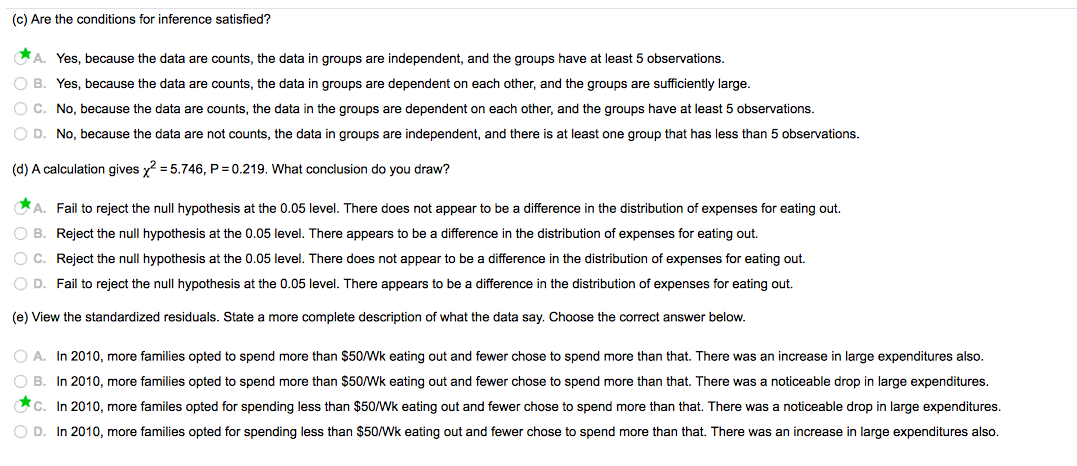
\fA national social survey polls 1000 adults each year throughout that time. One question asked in each survey was "How much does your family spend weekly on eating out?" The table shows the results for 2008 and 2010. Was there a change? Complete parts (a) through (e) below. Click the icon to view the summary statistics and the standardized residuals. (a) Would you interpret a chi-square test as a test of homogeneity or a test of independence? O A. A test of independence because we have two categorical variables measured on a single population. B. A test of homogeneity because we have a single categorical variable measured independently on two or more populations. O C. A test of homogeneity because we are comparing our observed counts to the expected counts from a given model. O D. A test of independence because we have a null hypothesis that the distributions are the same for all groups. (b) Write the appropriate hypotheses. Choose the correct answer below. O A. Ho: The amount families spent on eating out decreased between 2008 and 2010. HA: The amount families spent on eating out increased or stayed the same between 2008 and 2010. B. Ho: The numbers of families spending each amount on eating out did not change between 2008 and 2010. HA: The number of families spending each amount on eating out changed between 2008 and 2010. O C. Ho: The amount families spent on eating out did not change between 2008 and 2010. HA: The amount families spent on eating out changed between 2008 and 2010. O D. Ho: The numbers of families spending each amount on eating out decreased between 2008 and 2010. HA: The number of families spending each amount on eating out increased or stayed the same between 2008 and 2010.(c) Are the conditions for inference satisfied? A. Yes, because the data are counts, the data in groups are independent, and the groups have at least 5 observations. O B. Yes, because the data are counts, the data in groups are dependent on each other, and the groups are sufficiently large. O C. No, because the data are counts, the data in the groups are dependent on each other, and the groups have at least 5 observations. O D. No, because the data are not counts, the data in groups are independent, and there is at least one group that has less than 5 observations. (d) A calculation gives x2 = 5.746, P =0.219. What conclusion do you draw? A. Fail to reject the null hypothesis at the 0.05 level. There does not appear to be a difference in the distribution of expenses for eating out. O B. Reject the null hypothesis at the 0.05 level. There appears to be a difference in the distribution of expenses for eating out. O C. Reject the null hypothesis at the 0.05 level. There does not appear to be a difference in the distribution of expenses for eating out. O D. Fail to reject the null hypothesis at the 0.05 level. There appears to be a difference in the distribution of expenses for eating out. (e) View the standardized residuals. State a more complete description of what the data say. Choose the correct answer below. O A. In 2010, more families opted to spend more than $50/Wk eating out and fewer chose to spend more than that. There was an increase in large expenditures also. O B. In 2010, more families opted to spend more than $50/Wk eating out and fewer chose to spend more than that. There was a noticeable drop in large expenditures. C. In 2010, more familes opted for spending less than $50/Wk eating out and fewer chose to spend more than that. There was a noticeable drop in large expenditures. O D. In 2010, more families opted for spending less than $50/Wk eating out and fewer chose to spend more than that. There was an increase in large expenditures also