

Answered step by step
Verified Expert Solution
Question
1 Approved Answer
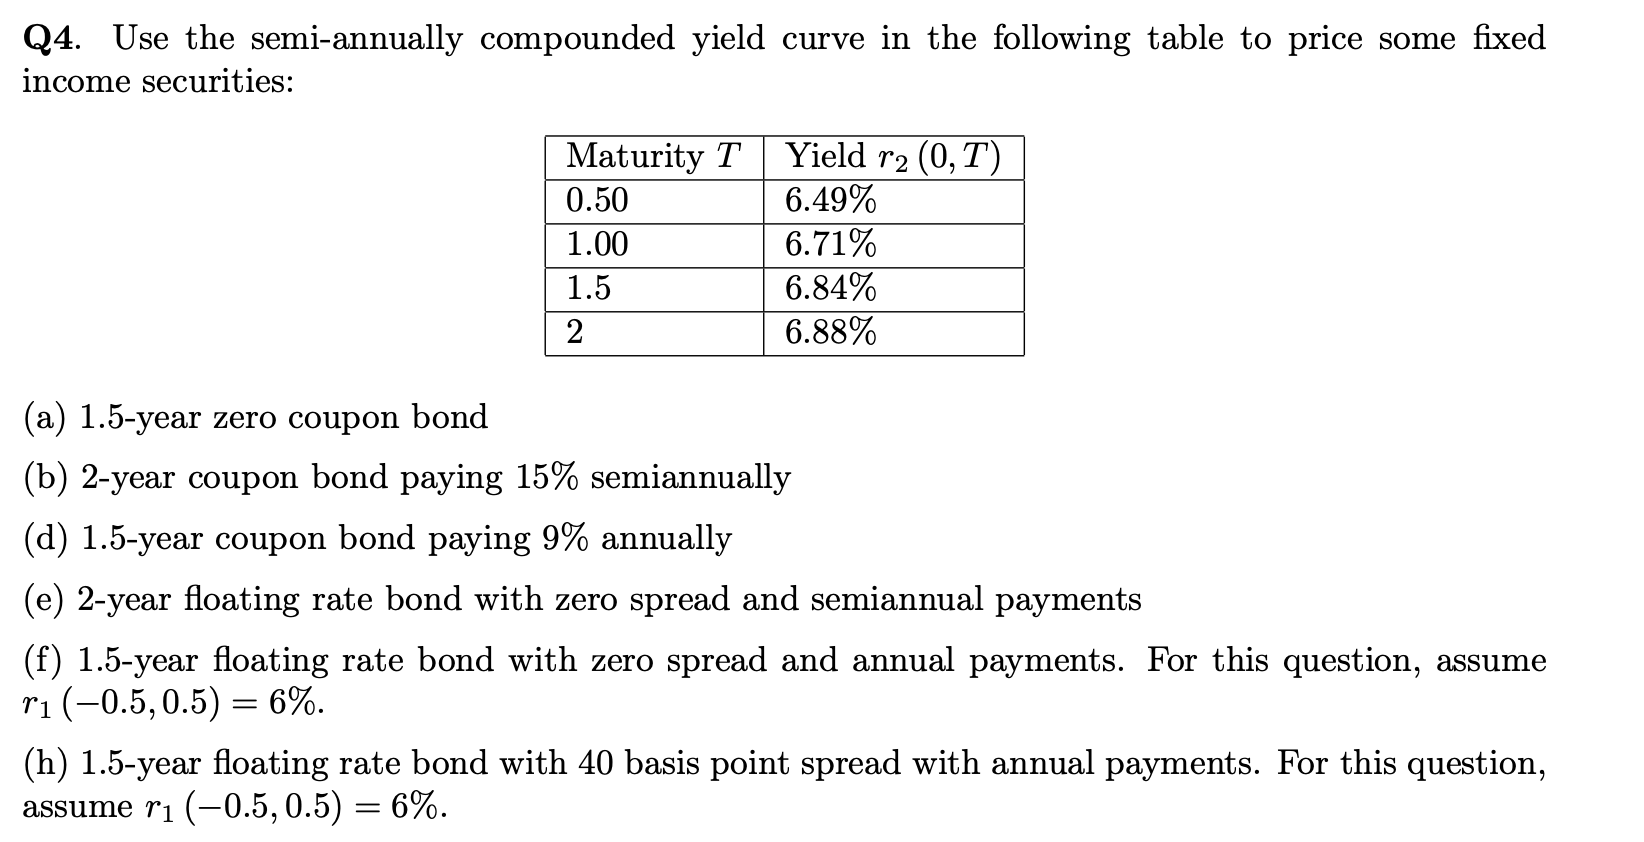
Q4. Use the semi-annually compounded yield curve in the following table to price some fixed income securities: Maturity T Yield r2 (0,T) 0.50 6.49% 1.00
Step by Step Solution
There are 3 Steps involved in it
Step: 1

Get Instant Access to Expert-Tailored Solutions
See step-by-step solutions with expert insights and AI powered tools for academic success
Step: 2

Step: 3
Ace Your Homework with AI
Get the answers you need in no time with our AI-driven, step-by-step assistance
Get Started
Essentials Of Health Care Finance
Authors: William O. Cleverley
3rd Edition
0834203413, 978-0834203419