Answered step by step
Verified Expert Solution
Question
1 Approved Answer
Q44 Considering our review of location strategies, on the crossover chart where the costs of two or more location alternatives have been plotted, the quantity
Q44

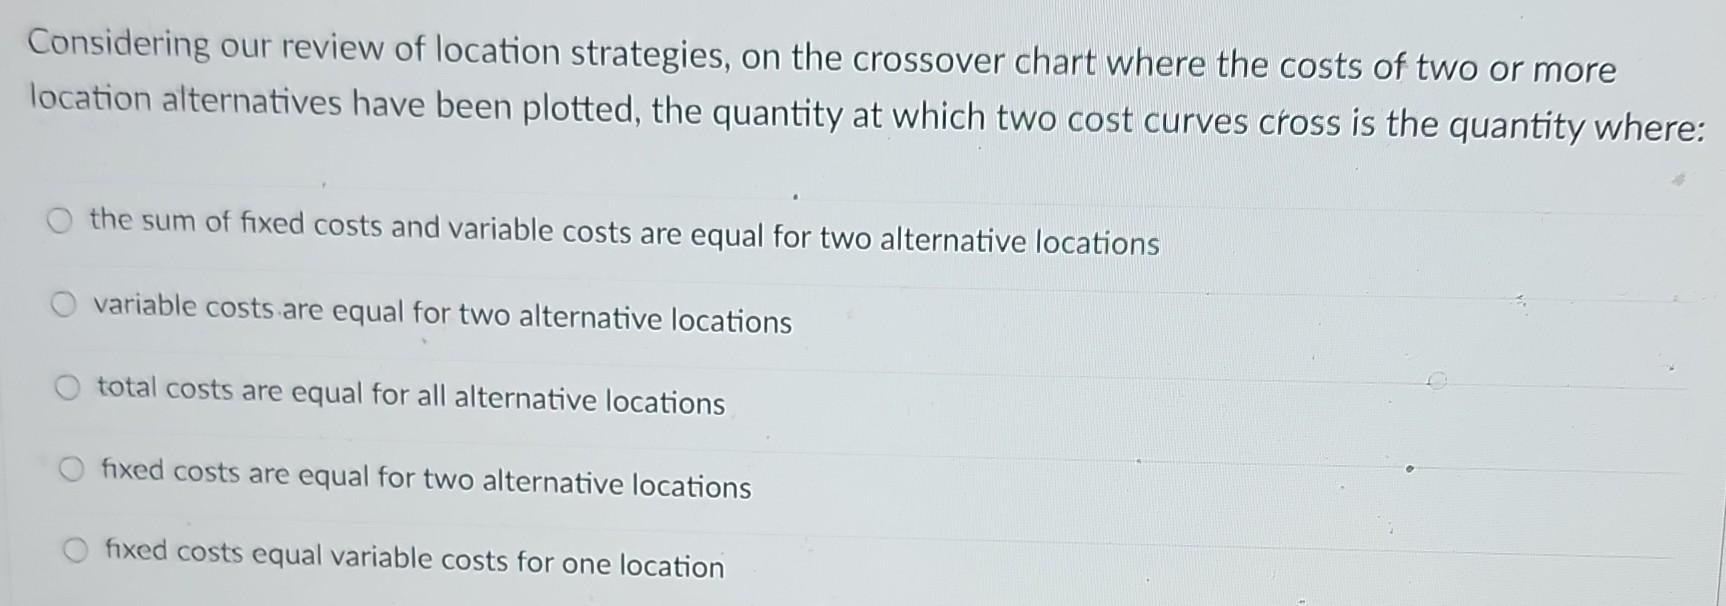
Considering our review of location strategies, on the crossover chart where the costs of two or more location alternatives have been plotted, the quantity at which two cost curves cross is the quantity where: the sum of fixed costs and variable costs are equal for two alternative locations variable costs are equal for two alternative locations total costs are equal for all alternative locations fixed costs are equal for two alternative locations fixed costs equal variable costs for one location
Step by Step Solution
There are 3 Steps involved in it
Step: 1

Get Instant Access to Expert-Tailored Solutions
See step-by-step solutions with expert insights and AI powered tools for academic success
Step: 2

Step: 3

Ace Your Homework with AI
Get the answers you need in no time with our AI-driven, step-by-step assistance
Get Started


