

Question: Q45: Why the answer is E? These questions refer to the following graph. NATIONAL SAVINGS RATE AND REAL GROSS NATIONAL PRODUCT (GNP) GROWTH RATE FOR
Q45: Why the answer is E?
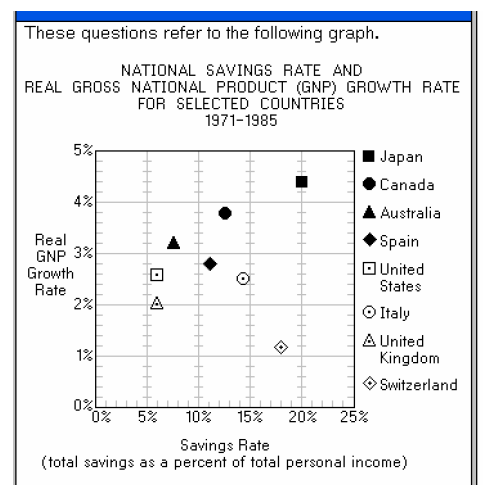
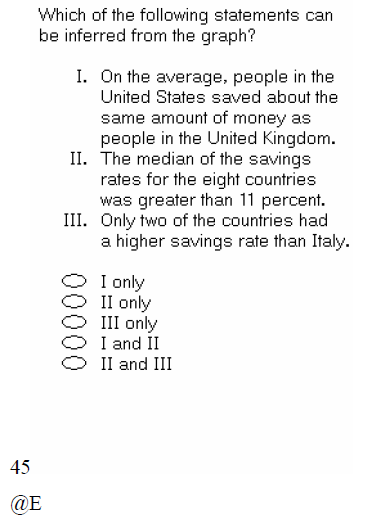
These questions refer to the following graph. NATIONAL SAVINGS RATE AND REAL GROSS NATIONAL PRODUCT (GNP) GROWTH RATE FOR SELECTED COUNTRIES 1971-1985 5% + Japan Canada 4% Australia Real Spain GNP 3% Growth United Rate States 2% A Italy O A United 1% Kingdom Switzerland 0XL 0% 5% 10% 15% 20% 25% Savings Rate (total savings as a percent of total personal income)Which of the following statements can be inferred from the graph? I. On the average, people in the United States saved about the Same amount of money as people in the United Kingdom. II. The median of the savings rates for the eight countries was greater than 11 percent. III. Only two of the countries had a higher savings rate than Italy. I only II only 00000 III only I and II II and III 45 @E
Step by Step Solution
There are 3 Steps involved in it

Get step-by-step solutions from verified subject matter experts