Answered step by step
Verified Expert Solution
Question
1 Approved Answer
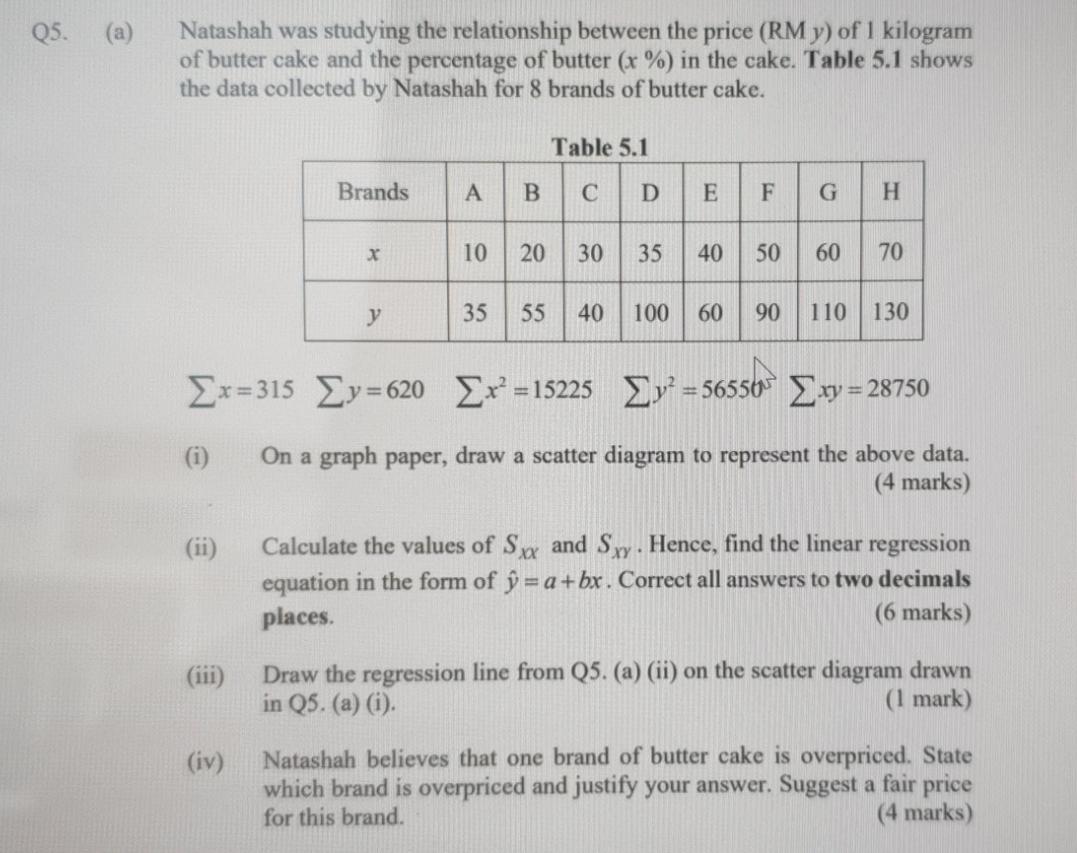
Q5. (a) Natashah was studying the relationship between the price (RM y) of 1 kilogram of butter cake and the percentage of butter (x

Q5. (a) Natashah was studying the relationship between the price (RM y) of 1 kilogram of butter cake and the percentage of butter (x %) in the cake. Table 5.1 shows the data collected by Natashah for 8 brands of butter cake. Table 5.1 Brands A B C D E F G H X 10 20 20 y 35 55 55 55 40 30 30 35 70 40 100 80 60 90 40 50 60 70 60 90 110 130 =315 =620 x=1 =15225 = 56550 = 28750 (i) (iv) On a graph paper, draw a scatter diagram to represent the above data. (4 marks) Calculate the values of Sxx and Sy Hence, find the linear regression equation in the form of =a+bx. Correct all answers to two decimals places. (6 marks) Draw the regression line from Q5. (a) (ii) on the scatter diagram drawn in Q5. (a) (i). (1 mark) Natashah believes that one brand of butter cake is overpriced. State which brand is overpriced and justify your answer. Suggest a fair price for this brand. (4 marks)
Step by Step Solution
There are 3 Steps involved in it
Step: 1

Get Instant Access to Expert-Tailored Solutions
See step-by-step solutions with expert insights and AI powered tools for academic success
Step: 2

Step: 3

Ace Your Homework with AI
Get the answers you need in no time with our AI-driven, step-by-step assistance
Get Started


