

Answered step by step
Verified Expert Solution
Question
1 Approved Answer
q5 An NPY profile plots a project's NPV at various costs of capital, labeled A and B in the graph. A project's NPV profile is
q5 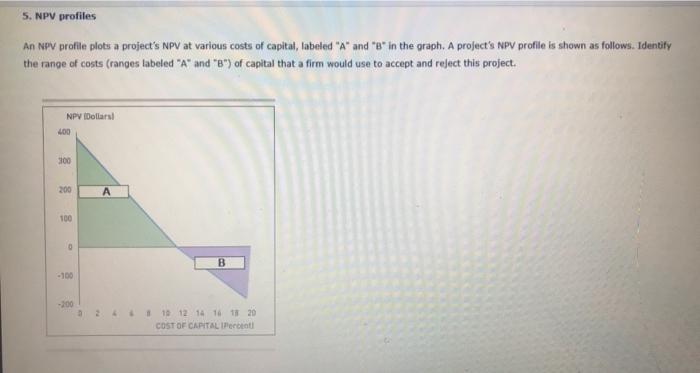
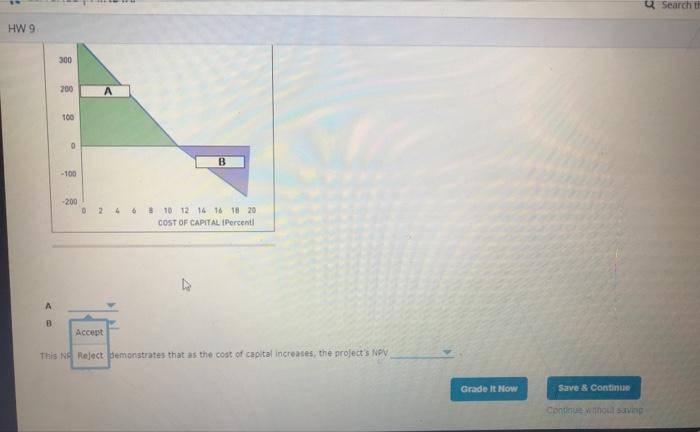
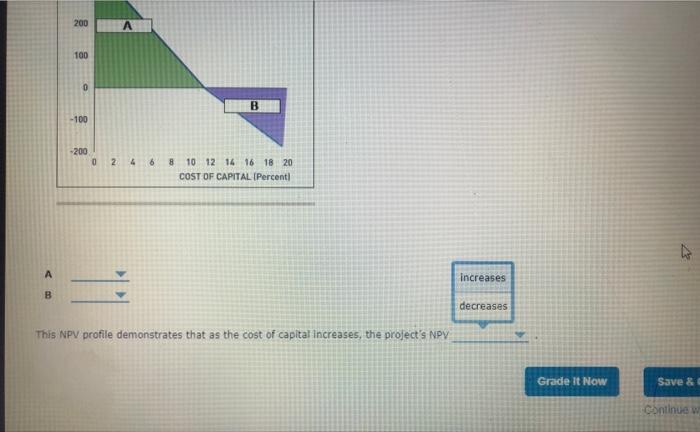 An NPY profile plots a project's NPV at various costs of capital, labeled "A" and "B" in the graph. A project's NPV profile is shown as follows. Identify the range of costs (ranges labeled " A" and " B ") of capital that a firm would use to accept and reject this project. emonatrates that as the cost of capial increases, the grolect's fiff This NPV profile demonstrates that as the cost of capital increases, the project's NPV
Step by Step Solution
There are 3 Steps involved in it
Step: 1

Get Instant Access to Expert-Tailored Solutions
See step-by-step solutions with expert insights and AI powered tools for academic success
Step: 2

Step: 3
Ace Your Homework with AI
Get the answers you need in no time with our AI-driven, step-by-step assistance
Get Started
The Changing Geography Of Banking And Finance
Authors: Pietro Alessandrini ,Michele Fratianni ,Alberto Zazzaro
1st Edition
1441947205, 978-1441947208