

Question
Q5. Can you reject the null hypothesis: Null hypothesis for the relationship between fire history (years since fire) and plant species richness- No statistical relationship
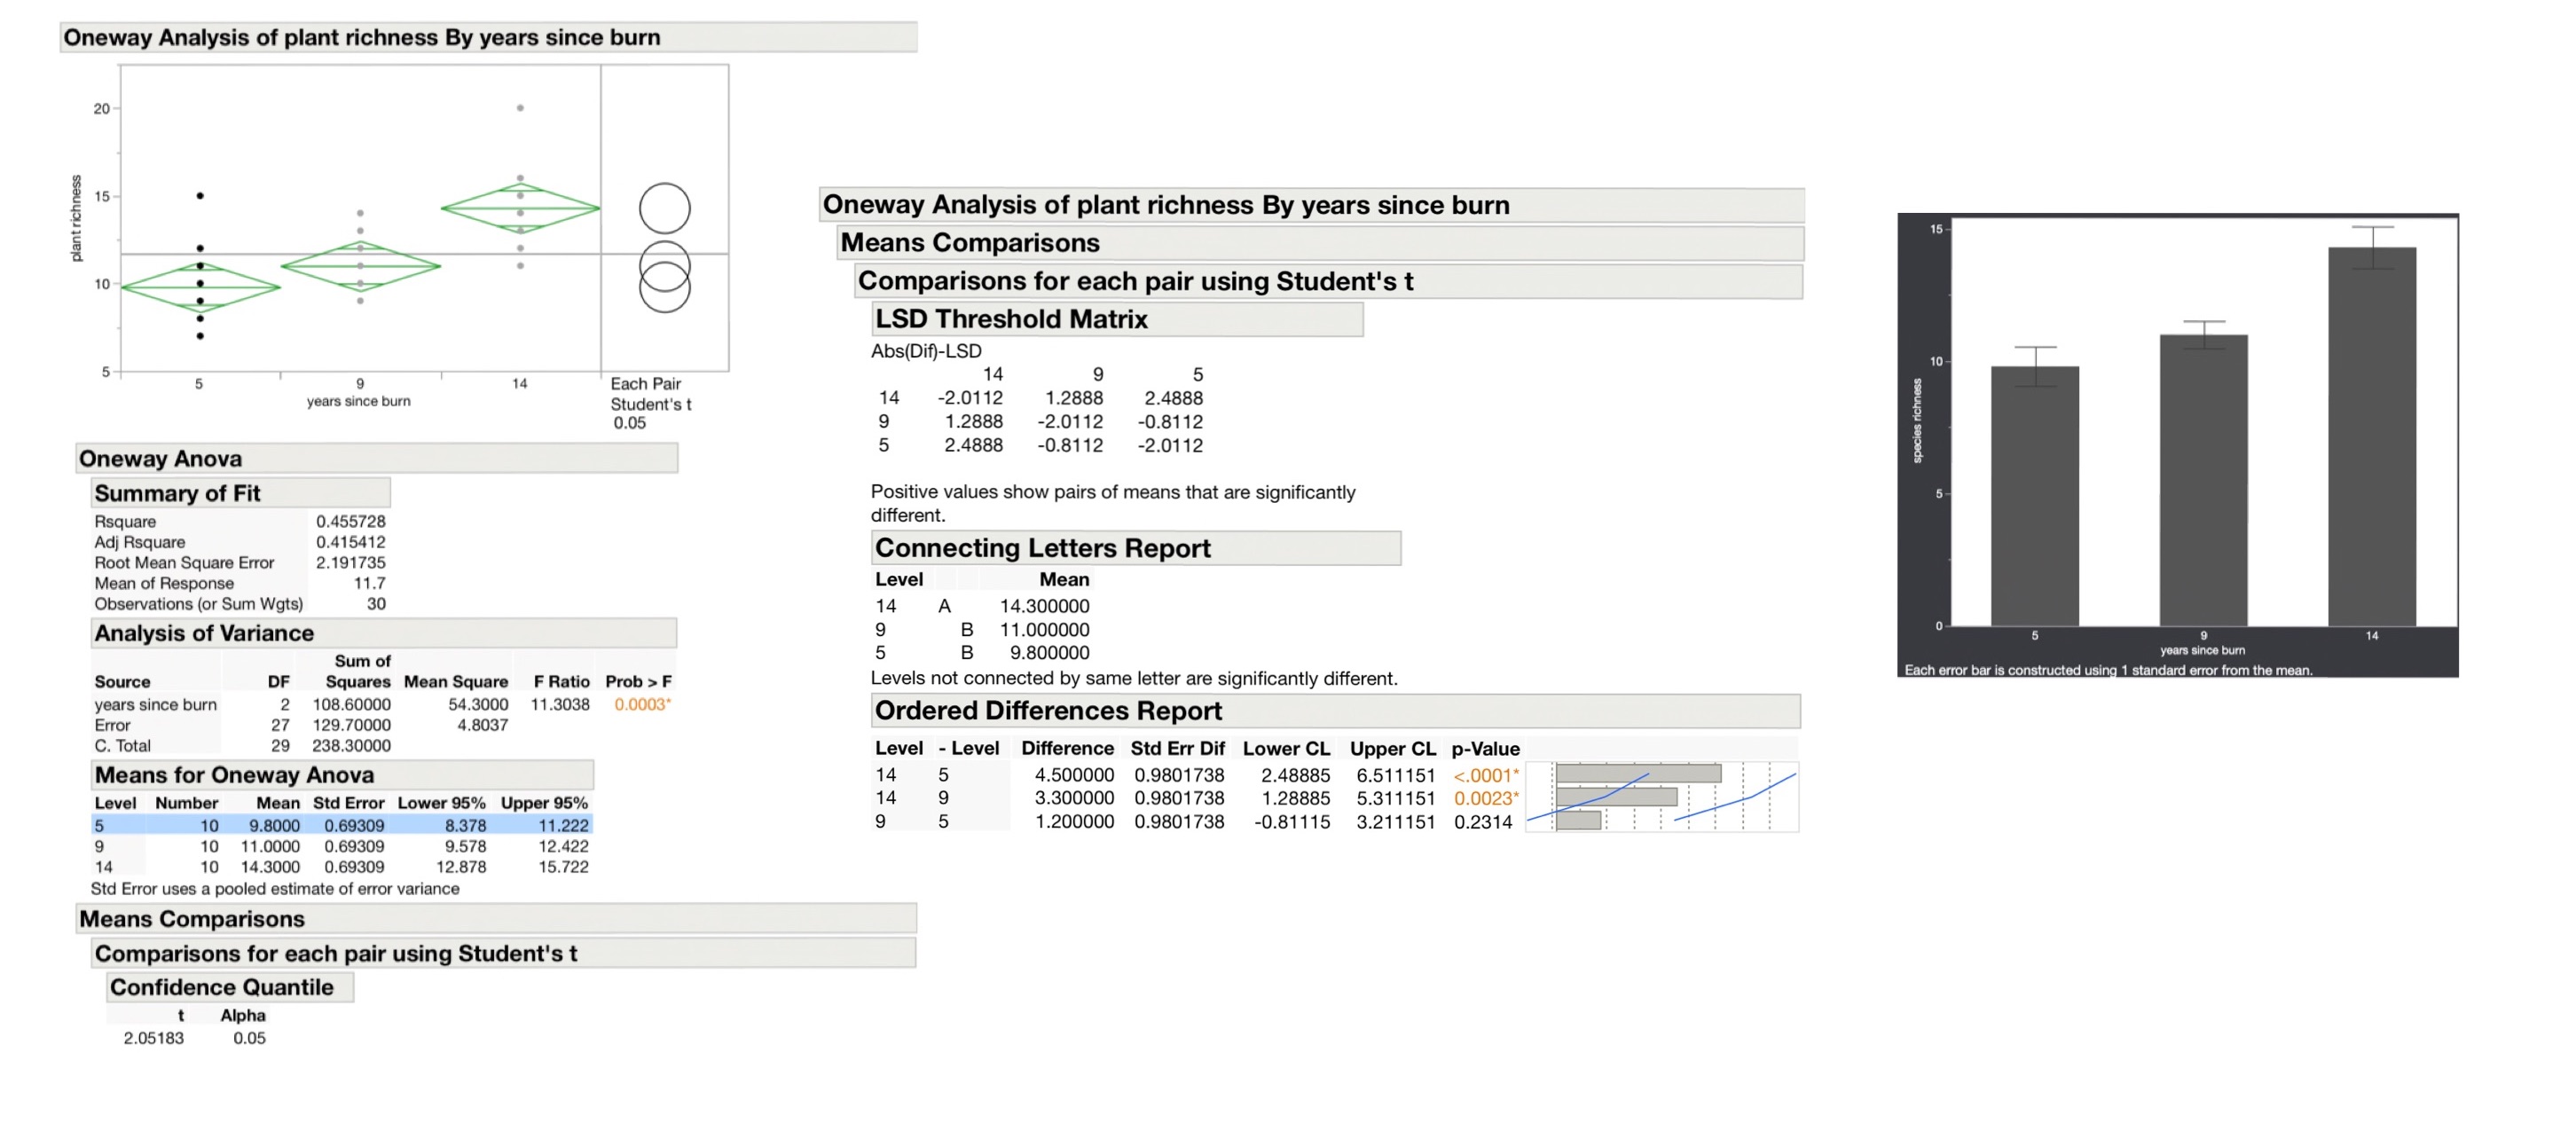
Q5. Can you reject the null hypothesis: Null hypothesis for the relationship between fire history (years since fire) and plant species richness- No statistical relationship between fire history (years since burn) and plant species richnessYes or NoQ6. Write out your statistical result in the formal format of ecological findings: a single, precise sentence telling how time since wildfire affected the response variable, followed by a summary of statistical information in parentheses as follows:Concise sentence describing the relationship supported by the statistical test (F=XX, p=XX).??After performing Post-Hoc TEST (please see attached image)Q7. Describe, in a sentence (or two), which burn years differ significantly in their richness levels and which do not.Q8. What is the p-value associated with the difference in richness between areas burned 14 and 9 years agoQ9 .Does richness increase or decline with time since the last wildfire?

Step by Step Solution
There are 3 Steps involved in it
Step: 1

Get Instant Access to Expert-Tailored Solutions
See step-by-step solutions with expert insights and AI powered tools for academic success
Step: 2

Step: 3
Ace Your Homework with AI
Get the answers you need in no time with our AI-driven, step-by-step assistance
Get Started
Elementary Number Theory
Authors: Underwood Dudley
1st Edition
0486134873, 9780486134871