

Answered step by step
Verified Expert Solution
Question
1 Approved Answer
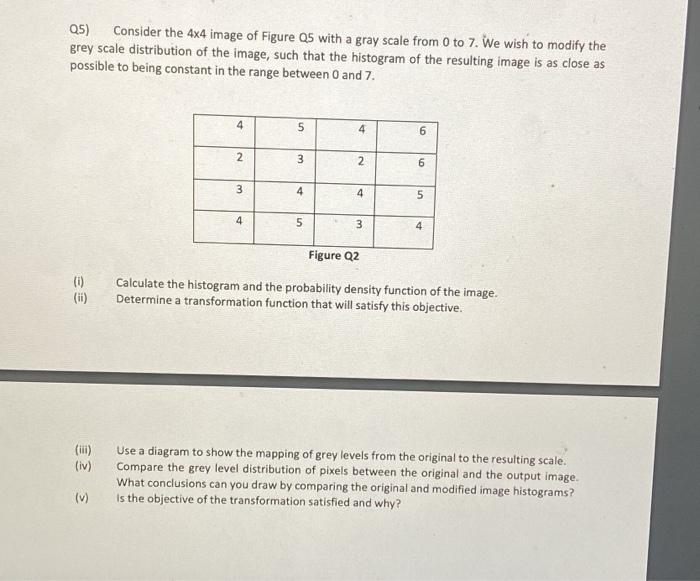
Q5) Consider the 4x4 image of Figure Q5 with a gray scale from 0 to 7. We wish to modify the grey scale distribution of
Step by Step Solution
There are 3 Steps involved in it
Step: 1

Get Instant Access to Expert-Tailored Solutions
See step-by-step solutions with expert insights and AI powered tools for academic success
Step: 2

Step: 3
Ace Your Homework with AI
Get the answers you need in no time with our AI-driven, step-by-step assistance
Get Started
Applications Of Databases First International Conference Adb 94 Vadstena Sweden June 21 23 1994 Proceedings Lncs 819
Authors: Witold Litwin ,Tore Risch
1st Edition
3540581839, 978-3540581833