

Question
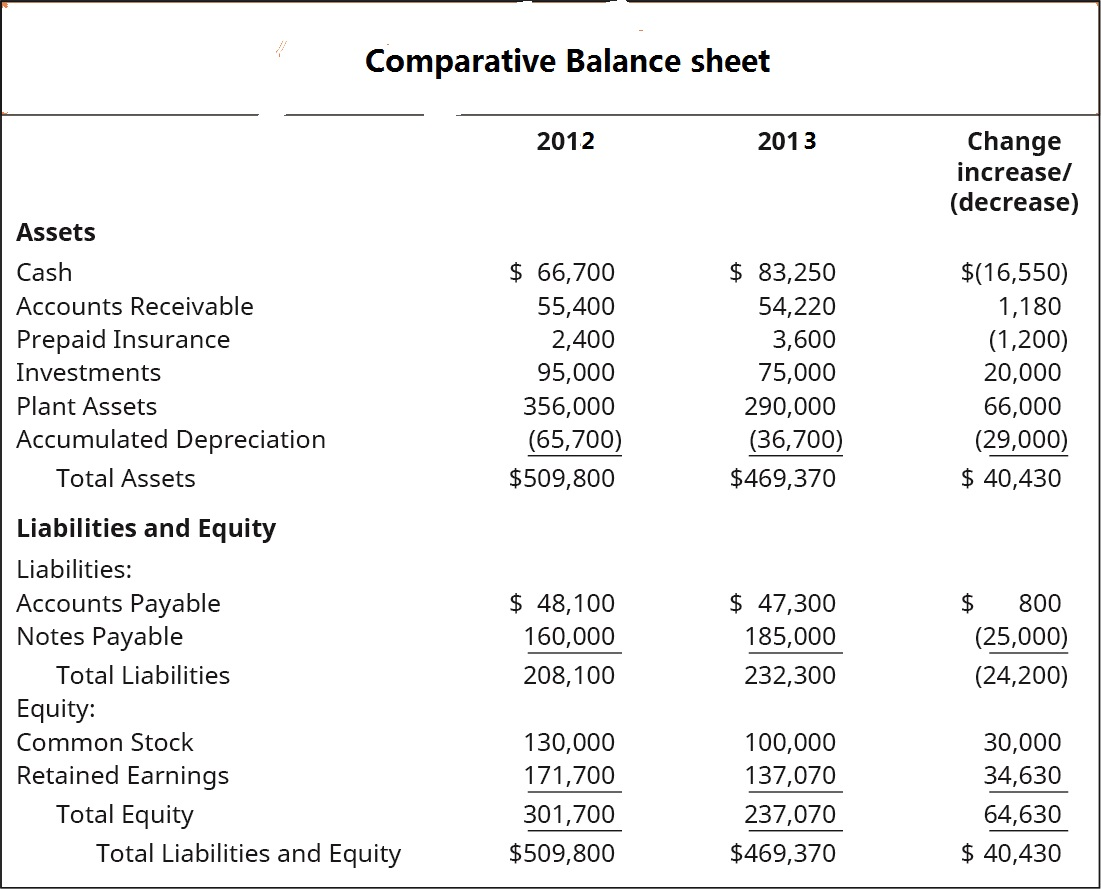
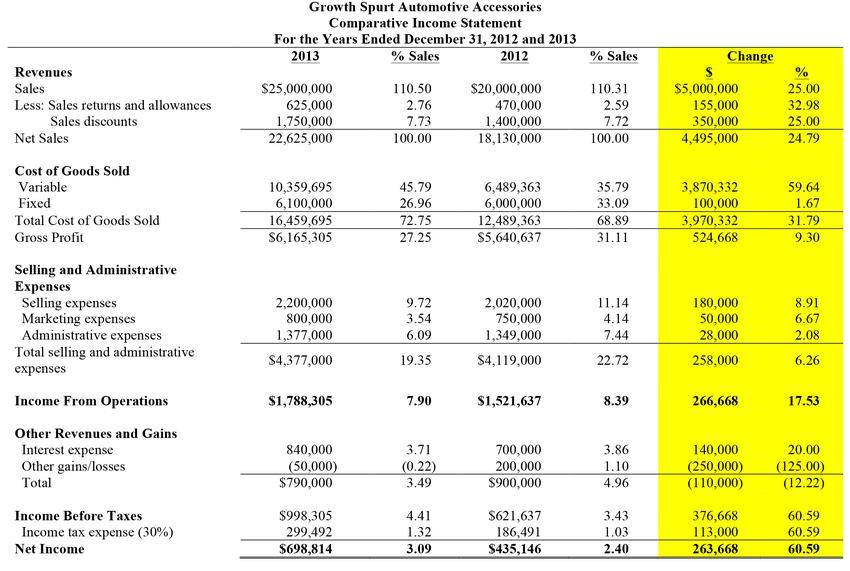
Q5. Using the information in the Balance Sheet and Profit and Loss Statement below, calculate the following ratios and answer the questions (8 points in
Q5. Using the information in the Balance Sheet and Profit and Loss Statement below, calculate the following ratios and answer the questions (8 points in total)
1) Calculate the following Liqudity Ratios
Current ratio =
Quick ratio =
2) Calculate the following Profitability Ratios
Return on Invested Capital (ROIC) ratio =
Return on Owner's Equity (ROE) ratio =
Profit as Percentage of Sales ratio =
3) Based on the above ratio analysis, what conclusions/observations can you make regarding the financial situation of this company. (if any)?
Comparative Balance sheet 2012 2013 Change increase/ (decrease) $ 66,700 55,400 2,400 95,000 356,000 (65,700) $509,800 $ 83,250 54,220 3,600 75,000 290,000 (36,700) $469,370 $(16,550) 1,180 (1,200) 20,000 66,000 (29,000) $ 40,430 Assets Cash Accounts Receivable Prepaid Insurance Investments Plant Assets Accumulated Depreciation Total Assets Liabilities and Equity Liabilities: Accounts Payable Notes Payable Total Liabilities Equity: Common Stock Retained Earnings Total Equity Total Liabilities and Equity $ 48,100 160,000 208,100 $ 47,300 185,000 232,300 $ 800 (25,000) (24,200) 130,000 171,700 301,700 $509,800 100,000 137,070 237,070 $469,370 30,000 34,630 64,630 $ 40,430 Growth Spurt Automotive Accessories Comparative Income Statement For the Year's Ended December 31, 2012 and 2013 2013 % Sales 2012 % Sales Change % Revenues Sales Less: Sales returns and allowances Sales discounts Net Sales $25,000,000 625,000 1,750,000 22,625,000 110.50 2.76 7.73 100.00 $20,000,000 470,000 1,400,000 18,130,000 110.31 2.59 7.72 100.00 $5,000,000 155,000 350,000 4,495,000 25.00 32.98 25.00 24.79 Cost of Goods Sold Variable Fixed Total Cost of Goods Sold Gross Profit 10,359,695 6,100,000 16,459,695 S6,165,305 45.79 26.96 72.75 27.25 6,489,363 6,000,000 12,489,363 $5,640,637 35.79 33.09 68.89 31.11 3,870,332 100,000 3,970,332 524,668 59.64 1.67 31.79 9.30 0 20 8.91 Selling and Administrative Expenses Selling expenses Marketing expenses Administrative expenses Total selling and administrative expenses 2,200,000 800,000 1,377,000 $4,377,000 9.72 3.54 6.09 2,020,000 750,000 1,349,000 11.14 4.14 7.44 180,000 50,000 28,000 6.67 2.08 19.35 $4,119,000 22.72 258,000 6.26 Income From Operations $1,788,305 7.90 $1,521,637 8.39 266,668 17.53 3.71 Other Revenues and Gains Interest expense Other gains/losses Total 840,000 (50,000) $790,000 (0.22) 3.49 700,000 200,000 $900,000 3.86 1.10 4.96 140,000 (250,000) (110,000) 20.00 (125.00) (12.22) Income Before Taxes Income tax expense (30%) Net Income $998,305 299,492 $698,814 4.41 1.32 3.09 S621,637 186,491 $435,146 3.43 1.03 2.40 376,668 113,000 263,668 60.59 60.59 60.59Step by Step Solution
There are 3 Steps involved in it
Step: 1

Get Instant Access to Expert-Tailored Solutions
See step-by-step solutions with expert insights and AI powered tools for academic success
Step: 2

Step: 3
Ace Your Homework with AI
Get the answers you need in no time with our AI-driven, step-by-step assistance
Get Started
How To Avoid IRS Audits
Authors: Victor S. Sy, CPA, MBA, Allana Santos, Roger Oriel, Louie Gajardo, Malou Aguilar Bledsoe, RJ Oriel, Mark Xavier Bautista, Kenno Samulde, Morton D Rosenthal Esq.
1st Edition
1530746477, 978-1530746477