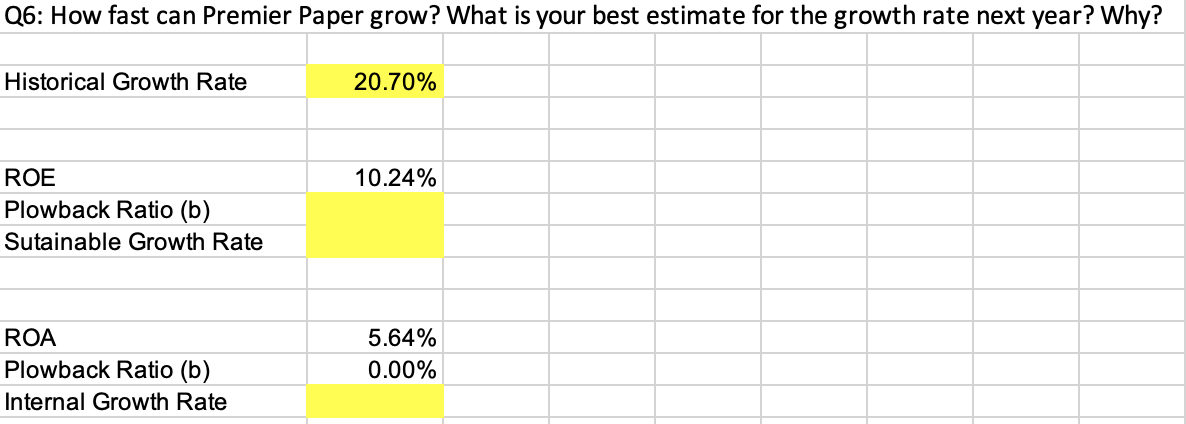
Q6: How fast can Premier Paper grow? What is your best estimate for the growth rate next year? Why?
NEED FORMULA NOT JUST NUMBER ANSWER, thank you!!


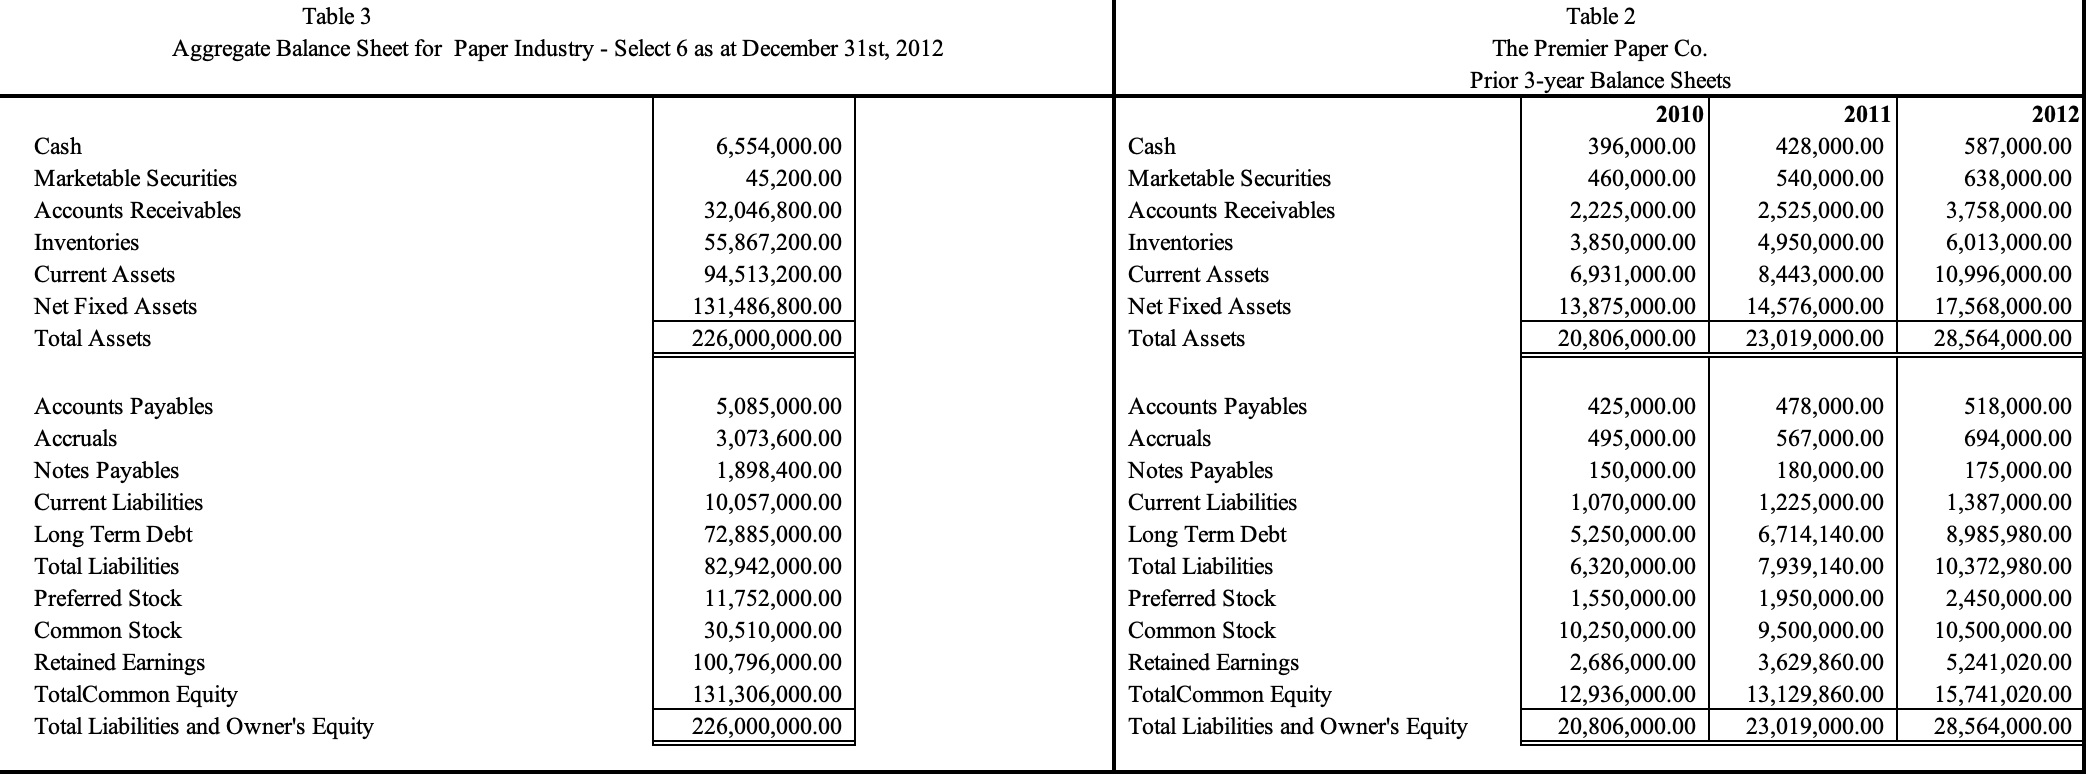
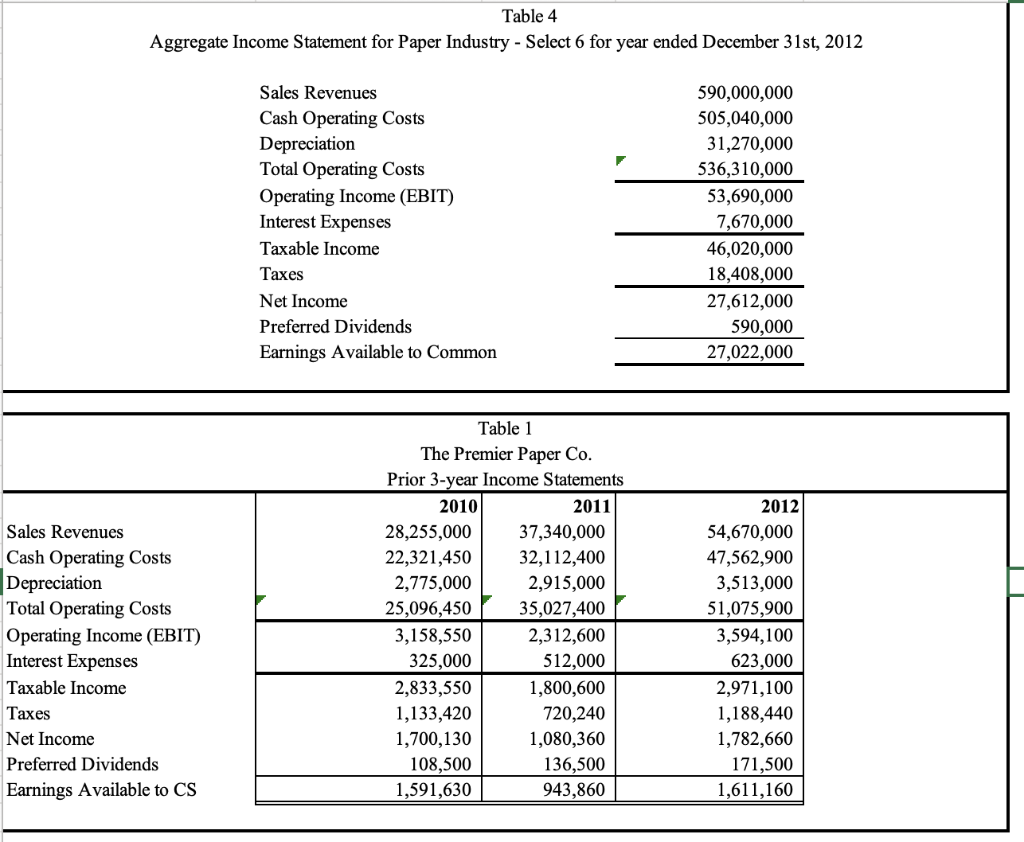
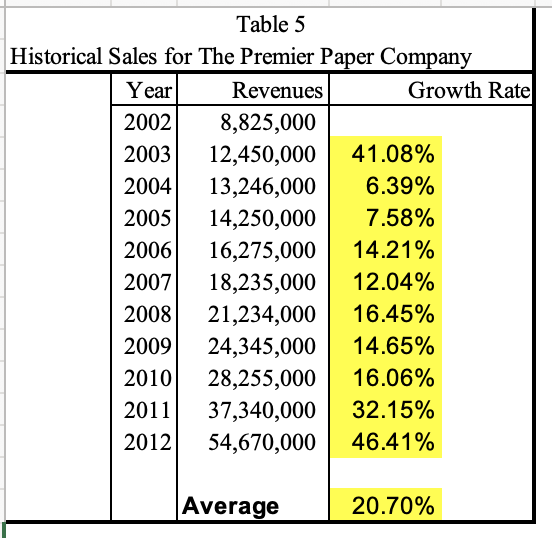
Table 3 Aggregate Balance Sheet for Paper Industry - Select 6 as at December 31st, 2012 Table 2 The Premier Paper Co. Prior 3-year Balance Sheets 2010 2011 2012 Cash Cash Marketable Securities Marketable Securities Accounts Receivables Accounts Receivables Inventories 6,554,000.00 45,200.00 32,046,800.00 55,867,200.00 94,513,200.00 131,486,800.00 226,000,000.00 Inventories 396,000.00 460,000.00 2,225,000.00 3,850,000.00 6,931,000.00 13,875,000.00 20,806,000.00 428,000.00 540,000.00 2,525,000.00 4,950,000.00 8,443,000.00 14,576,000.00 23,019,000.00 587,000.00 638,000.00 3,758,000.00 6,013,000.00 10,996,000.00 17,568,000.00 28,564,000.00 Current Assets Current Assets Net Fixed Assets Net Fixed Assets Total Assets Total Assets Accounts Payables Accruals Notes Payables Current Liabilities Long Term Debt Total Liabilities 5,085,000.00 3,073,600.00 1,898,400.00 10,057,000.00 72,885,000.00 82,942,000.00 11,752,000.00 30,510,000.00 100,796,000.00 131,306,000.00 226,000,000.00 Accounts Payables Accruals Notes Payables Current Liabilities Long Term Debt Total Liabilities 425,000.00 495,000.00 150,000.00 1,070,000.00 5,250,000.00 6,320,000.00 1,550,000.00 10,250,000.00 2,686,000.00 12,936,000.00 20,806,000.00 478,000.00 567,000.00 180,000.00 1,225,000.00 6,714,140.00 7,939,140.00 1,950,000.00 9,500,000.00 3,629,860.00 13,129,860.00 23,019,000.00 518,000.00 694,000.00 175,000.00 1,387,000.00 8,985,980.00 10,372,980.00 2,450,000.00 10,500,000.00 5,241,020.00 15,741,020.00 28,564,000.00 Preferred Stock Preferred Stock Common Stock Common Stock Retained Earnings TotalCommon Equity Total Liabilities and Owner's Equity Retained Earnings TotalCommon Equity Total Liabilities and Owner's Equity Table 4 Aggregate Income Statement for Paper Industry - Select 6 for year ended December 31st, 2012 Sales Revenues Cash Operating Costs Depreciation Total Operating Costs Operating Income (EBIT) Interest Expenses Taxable Income 590,000,000 505,040,000 31,270,000 536,310,000 53,690,000 7,670,000 46,020,000 18,408,000 27,612,000 590,000 27,022,000 Taxes Net Income Preferred Dividends Earnings Available to Common 2012 Sales Revenues Cash Operating Costs Depreciation Total Operating Costs Operating Income (EBIT) Interest Expenses Taxable Income Table 1 The Premier Paper Co. Prior 3-year Income Statements 2010 2011 28,255,000 37,340,000 22,321,450 32,112,400 2,775,000 2,915,000 25,096,450 35,027,400 3,158,550 2,312,600 325,000 512,000 2,833,550 1,800,600 1,133,420 720,240 1,700,130 1,080,360 108,500 136,500 1,591,630 943,860 54,670,000 47,562,900 3,513,000 51,075,900 3,594,100 623,000 2,971,100 1,188,440 1,782,660 171,500 1,611,160 Taxes Net Income Preferred Dividends Earnings Available to CS Q6: How fast can Premier Paper grow? What is your best estimate for the growth rate next year? Why? Historical Growth Rate 20.70% ROE 10.24% Plowback Ratio (b) Sutainable Growth Rate ROA Plowback Ratio (b) Internal Growth Rate 5.64% 0.00% Table 5 Historical Sales for The Premier Paper Company Year Revenues Growth Rate 2002 8,825,000 2003 12,450,000 41.08% 2004 13,246,000 6.39% 2005 14,250,000 7.58% 2006 16,275,000 14.21% 2007 18,235,000 12.04% 2008 21,234,000 16.45% 2009 24,345,000 14.65% 2010 28,255,000 16.06% 2011 37,340,000 32.15% 2012 54,670,000 46.41% Average 20.70%


