Answered step by step
Verified Expert Solution
Question
1 Approved Answer
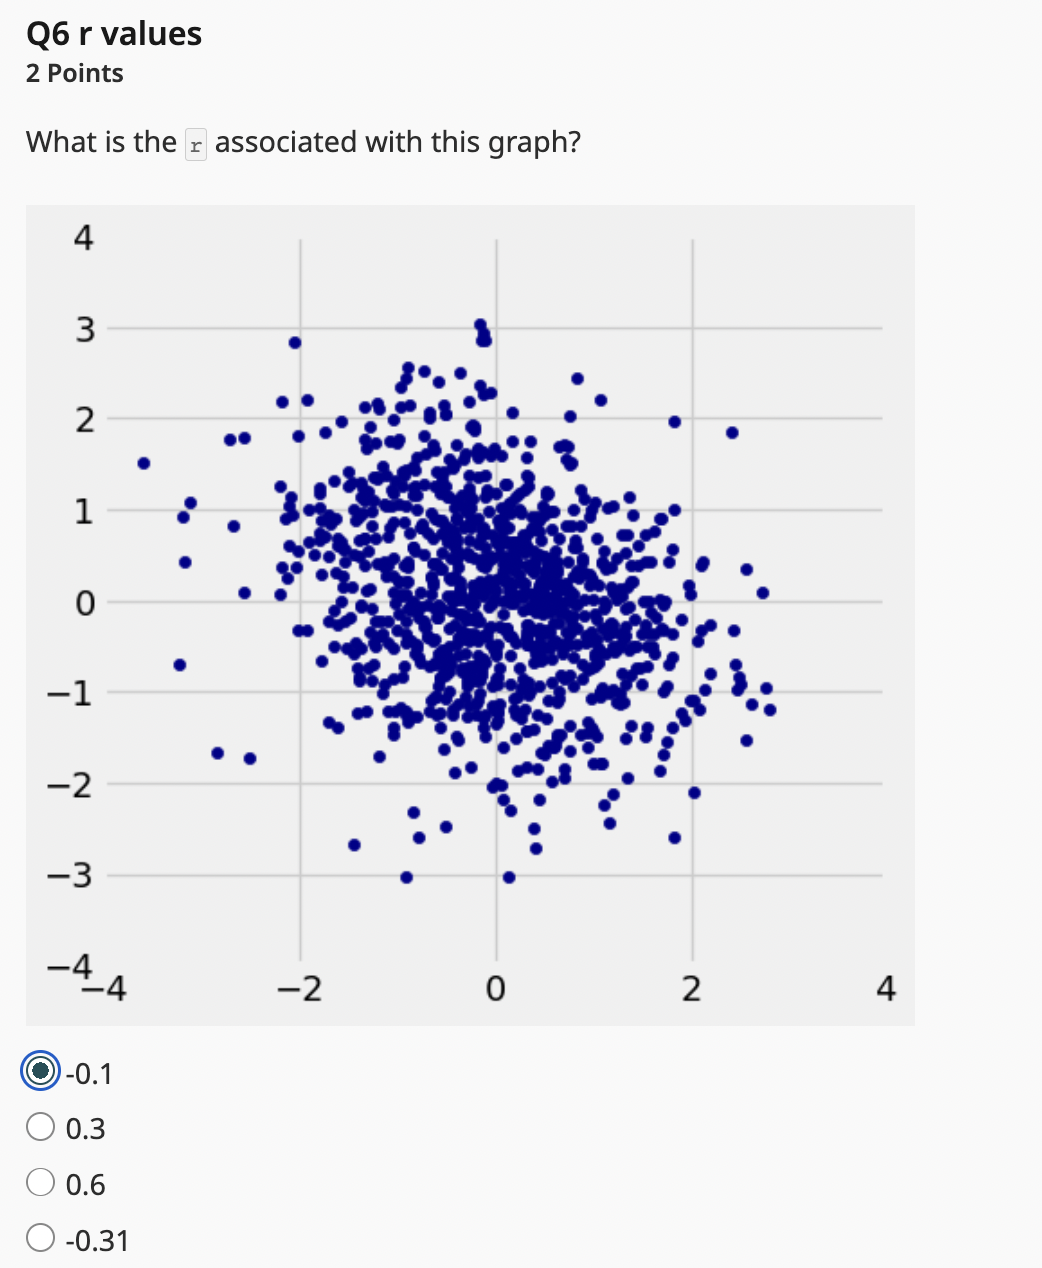
Q6 r values 2 Points What is the associated with this graph? 0.1 0.3 0.6 0.31 Q7 Student Fitness 4 Points Q7.1 Pull Ups FTW


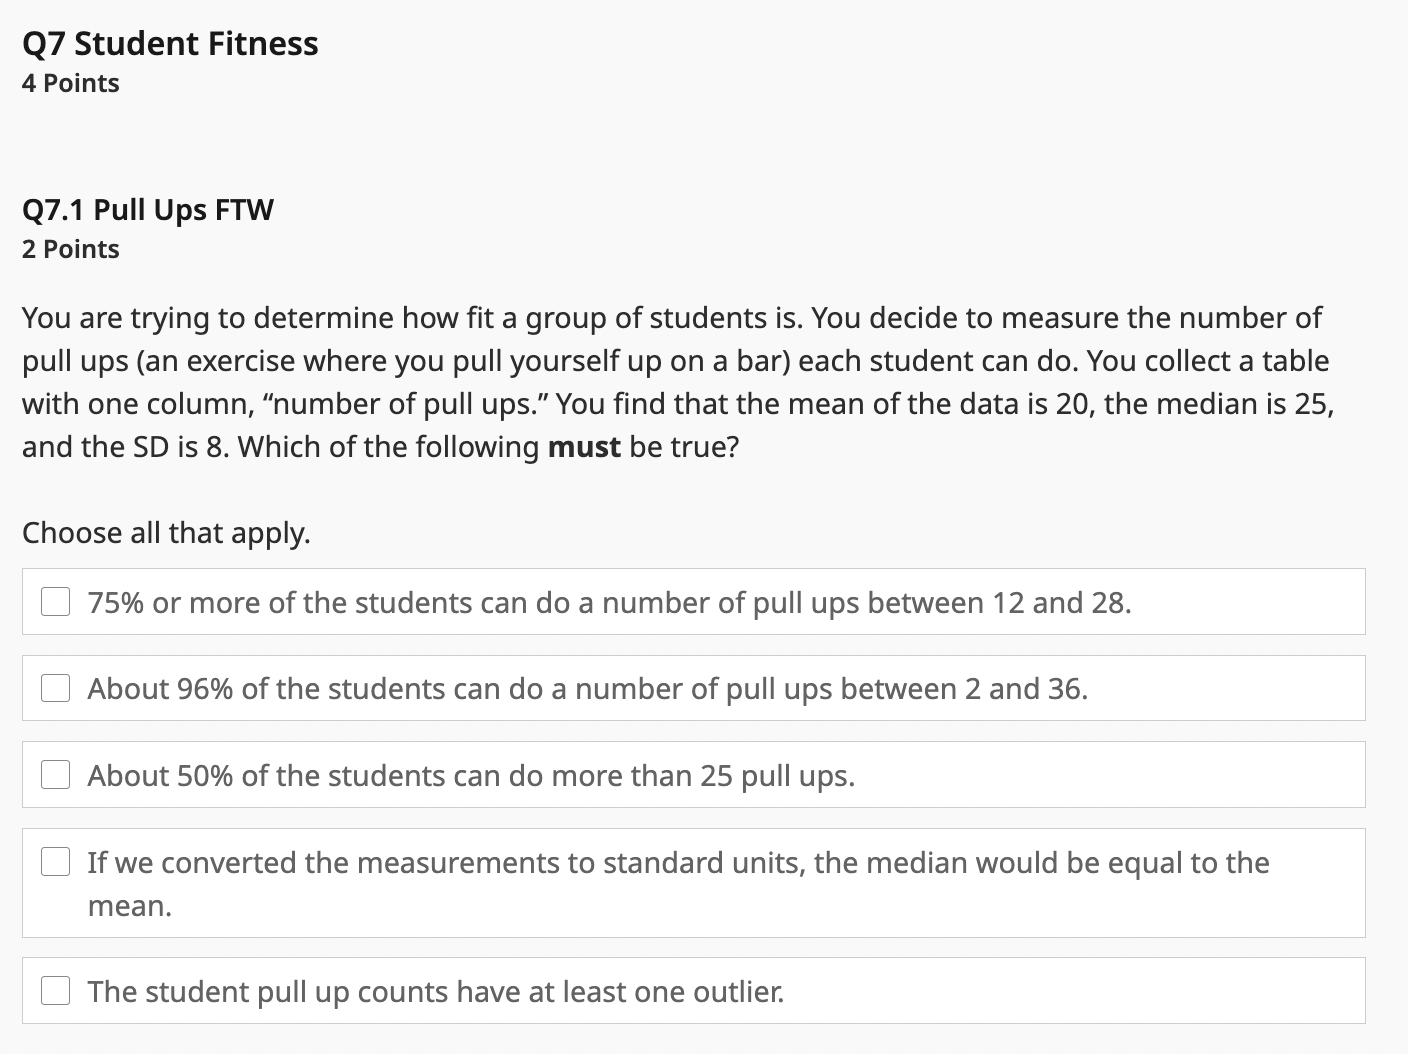
Q6 r values 2 Points What is the associated with this graph? 0.1 0.3 0.6 0.31 Q7 Student Fitness 4 Points Q7.1 Pull Ups FTW 2 Points You are trying to determine how fit a group of students is. You decide to measure the number of pull ups (an exercise where you pull yourself up on a bar) each student can do. You collect a table with one column, "number of pull ups." You find that the mean of the data is 20, the median is 25, and the SD is 8 . Which of the following must be true? Choose all that apply. 75% or more of the students can do a number of pull ups between 12 and 28 . About 96% of the students can do a number of pull ups between 2 and 36. About 50% of the students can do more than 25 pull ups. If we converted the measurements to standard units, the median would be equal to the mean. The student pull up counts have at least one outlier
Step by Step Solution
There are 3 Steps involved in it
Step: 1

Get Instant Access to Expert-Tailored Solutions
See step-by-step solutions with expert insights and AI powered tools for academic success
Step: 2

Step: 3

Ace Your Homework with AI
Get the answers you need in no time with our AI-driven, step-by-step assistance
Get Started


