

Answered step by step
Verified Expert Solution
Question
1 Approved Answer
q8&9 E6-30A. Regression analysis using Excel output (Learning Objective Assume that Broadway Floral does a regression analysis on the next year's data using Excel. The
q8&9 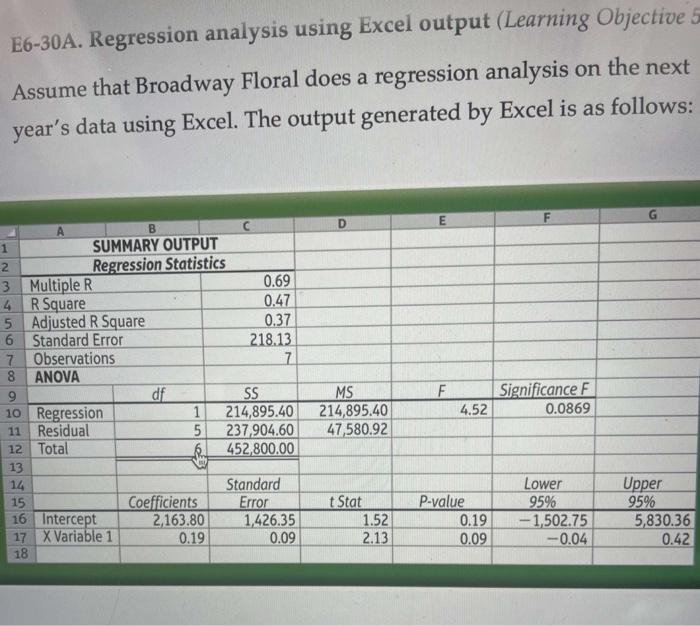
Step by Step Solution
There are 3 Steps involved in it
Step: 1

Get Instant Access to Expert-Tailored Solutions
See step-by-step solutions with expert insights and AI powered tools for academic success
Step: 2

Step: 3
Ace Your Homework with AI
Get the answers you need in no time with our AI-driven, step-by-step assistance
Get Started
Excise Tax Ozone Depleting Chemicals IRS Audit Techniques Guide
Authors: Internal Revenue Service
1st Edition
1304114279, 978-1304114273