Answered step by step
Verified Expert Solution
Question
1 Approved Answer
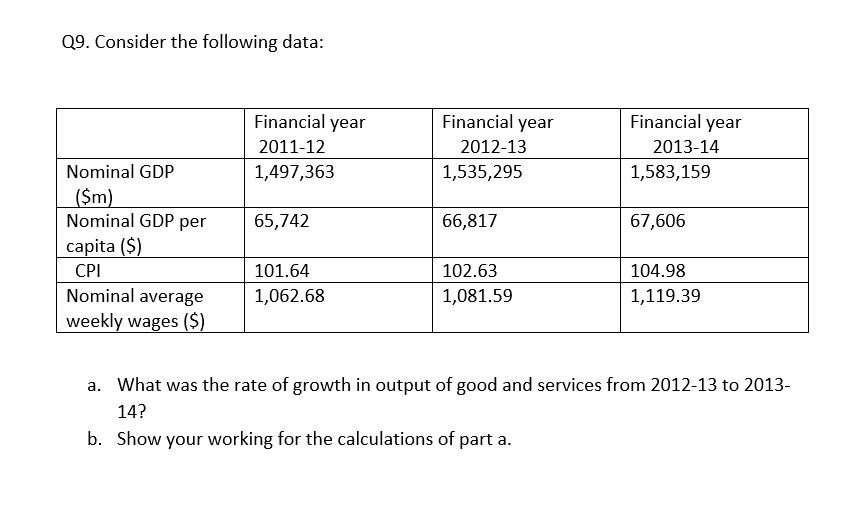
Q9. Consider the following data: Financial year 2011-12 Financial year 2012-13 Financial year 2013-14 Nominal GDP ($m) 1,497,363 1,535,295 1,583,159 Nominal GDP per capita ($)
Q9. Consider the following data:
Financial year
2011-12
Financial year
2012-13
Financial year
2013-14
Nominal GDP
($m)
1,497,363
1,535,295
1,583,159
Nominal GDP per capita ($)
65,742
66,817
67,606
CPI
101.64
102.63
104.98
Nominal average weekly wages ($)
1,062.68
1,081.59
1,119.39
a.What was the rate of growth in output of good and services from 2012-13 to 2013-14? (answer in percentage points, to two decimal places.)
b.Show your working for the calculations of part a.

Step by Step Solution
There are 3 Steps involved in it
Step: 1

Get Instant Access to Expert-Tailored Solutions
See step-by-step solutions with expert insights and AI powered tools for academic success
Step: 2

Step: 3

Ace Your Homework with AI
Get the answers you need in no time with our AI-driven, step-by-step assistance
Get Started


