

Answered step by step
Verified Expert Solution
Question
1 Approved Answer
Q9 The following table provides the worst 20 monthly tes of return the 100 months for a portfolio of stocks Jan 2021 -6.67% Dec 2018
Q9 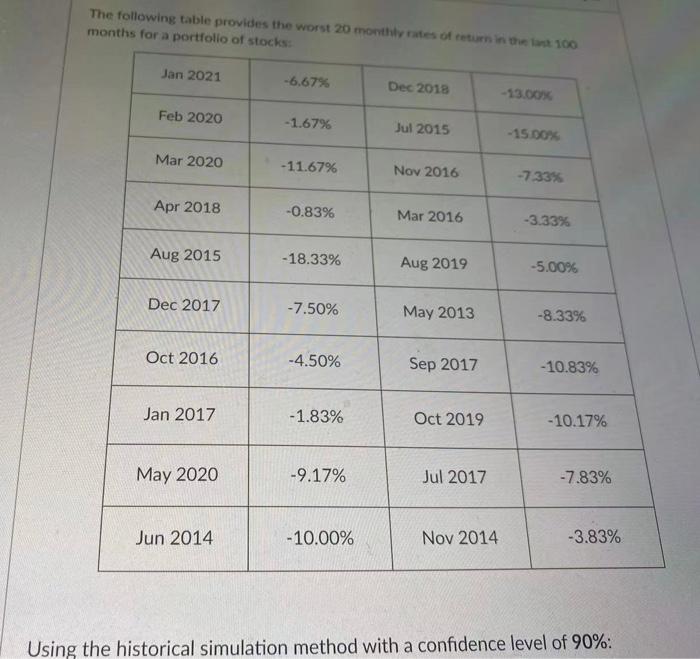
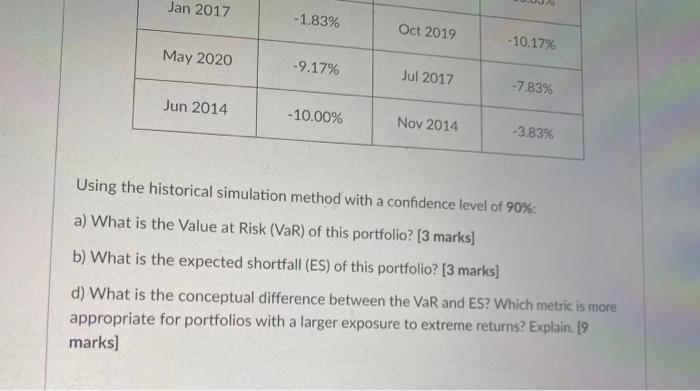
The following table provides the worst 20 monthly tes of return the 100 months for a portfolio of stocks Jan 2021 -6.67% Dec 2018 -13.00 Feb 2020 -1.67% Jul 2015 - 15.00 Mar 2020 - 11.67% Nov 2016 -733% Apr 2018 -0.83% Mar 2016 -3.33% Aug 2015 - 18.33% Aug 2019 -5.00% Dec 2017 -7.50% May 2013 -8.33% Oct 2016 -4.50% Sep 2017 -10.83% Jan 2017 -1.83% Oct 2019 -10.17% May 2020 -9.17% Jul 2017 -7.83% Jun 2014 - 10.00% Nov 2014 -3.83% Using the historical simulation method with a confidence level of 90%: Jan 2017 -1.83% Oct 2019 -10.17% May 2020 -9.17% Jul 2017 -7.83% Jun 2014 - 10.00% Nov 2014 -3.83% Using the historical simulation method with a confidence level of 90%: a) What is the Value at Risk (VaR) of this portfolio? [3 marks] b) What is the expected shortfall (ES) of this portfolio? [3 marks] d) What is the conceptual difference between the VaR and ES? Which metric is more appropriate for portfolios with a larger exposure to extreme returns? Explain. [9 marks] Step by Step Solution
There are 3 Steps involved in it
Step: 1

Get Instant Access to Expert-Tailored Solutions
See step-by-step solutions with expert insights and AI powered tools for academic success
Step: 2

Step: 3
Ace Your Homework with AI
Get the answers you need in no time with our AI-driven, step-by-step assistance
Get Started
Finance A Quantitative Introduction Volume 2
Authors: Piotr Staszkiewicz, Lucia Staszkiewicz
1st Edition
0128027975, 978-0128027974