Answered step by step
Verified Expert Solution
Question
1 Approved Answer
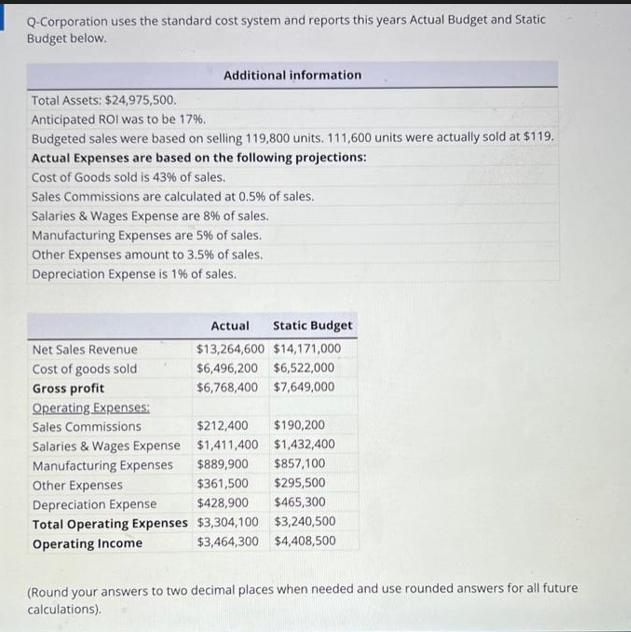
Q-Corporation uses the standard cost system and reports this years Actual Budget and Static Budget below. Total Assets: $24,975,500. Anticipated ROI was to be


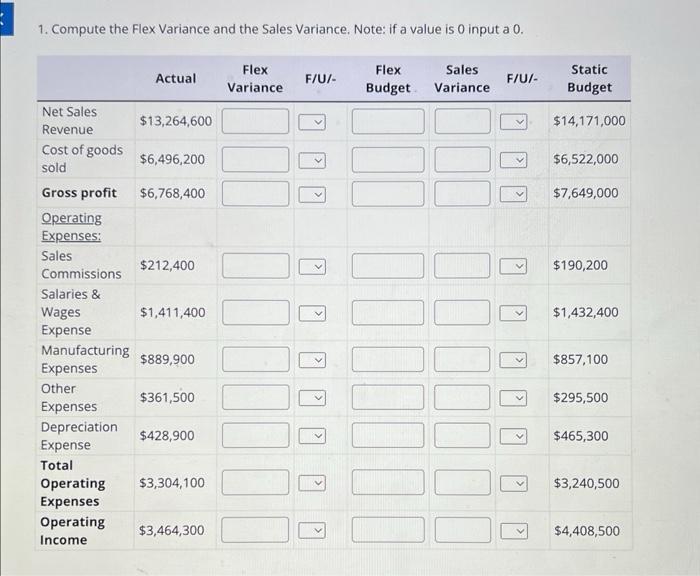
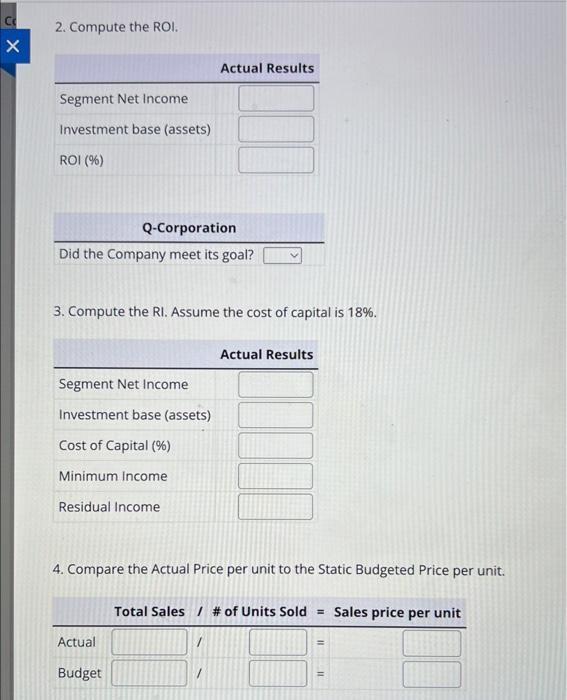
Q-Corporation uses the standard cost system and reports this years Actual Budget and Static Budget below. Total Assets: $24,975,500. Anticipated ROI was to be 17%. Budgeted sales were based on selling 119,800 units. 111,600 units were actually sold at $119. Actual Expenses are based on the following projections: Cost of Goods sold is 43% of sales. Sales Commissions are calculated at 0.5% of sales. Additional information Salaries & Wages Expense are 8% of sales. Manufacturing Expenses are 5% of sales. Other Expenses amount to 3.5% of sales. Depreciation Expense is 1% of sales. Net Sales Revenue Cost of goods sold Gross profit Operating Expenses: Sales Commissions Salaries & Wages Expense Manufacturing Expenses Other Expenses Depreciation Expense. Total Operating Expenses Operating Income Actual Static Budget $13,264,600 $14,171,000 $6,496,200 $6,522,000 $6,768,400 $7,649,000 $212,400 $190,200 $1,411,400 $1,432,400 $889,900 $857,100 $361,500 $295,500 $428,900 $465,300 $3,304,100 $3,240,500 $3,464,300 $4,408,500 (Round your answers to two decimal places when needed and use rounded answers for all future calculations). 1. Compute the Flex Variance and the Sales Variance. Note: if a value is 0 input a 0. Flex Variance Sales Variance Net Sales Revenue Cost of goods sold Gross profit Operating Expenses: Sales Commissions Salaries & Wages Expense Manufacturing Expenses Other Expenses Depreciation Expense Total Operating Expenses Operating Income Actual $13,264,600 $6,496,200 $6,768,400 $212,400 $1,411,400 $889,900 $361,500 $428,900 $3,304,100 $3,464,300 F/U/- Flex Budget 1000 F/U/- V V Static Budget $14,171,000 $6,522,000 $7,649,000 $190,200 $1,432,400 $857,100 $295,500 $465,300 $3,240,500 $4,408,500 X 2. Compute the ROI. Segment Net Income. Investment base (assets) ROI (%) Q-Corporation Did the Company meet its goal? 3. Compute the RI. Assume the cost of capital is 18%. Segment Net Income Investment base (assets) Cost of Capital (%) Minimum Income Actual Results Residual Income Actual Budget Actual Results 4. Compare the Actual Price per unit to the Static Budgeted Price per unit. Total Sales / # of Units Sold Sales price per unit 11 11
Step by Step Solution
★★★★★
3.33 Rating (153 Votes )
There are 3 Steps involved in it
Step: 1
ANSWER To answer the questions lets calculate the variances ROI Residual Income and compare the actual price per unit to the static budgeted price per unit 1 Compute the Flex Variance and the Sales Va...
Get Instant Access to Expert-Tailored Solutions
See step-by-step solutions with expert insights and AI powered tools for academic success
Step: 2

Step: 3

Ace Your Homework with AI
Get the answers you need in no time with our AI-driven, step-by-step assistance
Get Started


