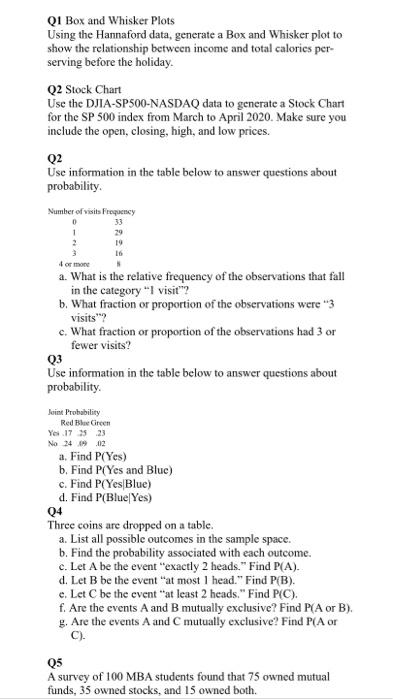
QI Box and Whisker Plots Using the Hannaford data, generate a Box and Whisker plot to show the relationship between income and total calories per- serving before the holiday. Q2 Stock Chart Use the DJIA-SP500-NASDAQ data to generate a Stock Chart for the SP 500 index from March to April 2020. Make sure you include the open, closing, high, and low prices. Q2 Use information in the table below to answer questions about probability. Number of visits Frequency 33 0 1 2 for more a. What is the relative frequency of the observations that fall in the category "I visit"? b. What fraction or proportion of the observations were "3 visits"? c. What fraction or proportion of the observations had 3 or fewer visits? Q3 Use information in the table below to answer questions about probability Q4 Joint Probability Red Blue Green Yes 175 23 No 249 02 a. Find P(Yes) b. Find P(Yes and Blue) c. Find P(Yes|Blue) d. Find P(Blue/Yes) Three coins are dropped on a table. a. List all possible outcomes in the sample space. b. Find the probability associated with each outcome. c. Let A be the event "exactly 2 heads." Find P(A). d. Let B be the event at most 1 head." Find P(B). e. Let C be the event at least 2 heads." Find PC). f. Are the events A and B mutually exclusive? Find P(A or B). 9. Are the events A and C mutually exclusive? Find P(A or C). Q5 A survey of 100 MBA students found that 75 owned mutual funds, 35 owned stocks, and 15 owned both. QI Box and Whisker Plots Using the Hannaford data, generate a Box and Whisker plot to show the relationship between income and total calories per- serving before the holiday. Q2 Stock Chart Use the DJIA-SP500-NASDAQ data to generate a Stock Chart for the SP 500 index from March to April 2020. Make sure you include the open, closing, high, and low prices. Q2 Use information in the table below to answer questions about probability. Number of visits Frequency 33 0 1 2 for more a. What is the relative frequency of the observations that fall in the category "I visit"? b. What fraction or proportion of the observations were "3 visits"? c. What fraction or proportion of the observations had 3 or fewer visits? Q3 Use information in the table below to answer questions about probability Q4 Joint Probability Red Blue Green Yes 175 23 No 249 02 a. Find P(Yes) b. Find P(Yes and Blue) c. Find P(Yes|Blue) d. Find P(Blue/Yes) Three coins are dropped on a table. a. List all possible outcomes in the sample space. b. Find the probability associated with each outcome. c. Let A be the event "exactly 2 heads." Find P(A). d. Let B be the event at most 1 head." Find P(B). e. Let C be the event at least 2 heads." Find PC). f. Are the events A and B mutually exclusive? Find P(A or B). 9. Are the events A and C mutually exclusive? Find P(A or C). Q5 A survey of 100 MBA students found that 75 owned mutual funds, 35 owned stocks, and 15 owned both