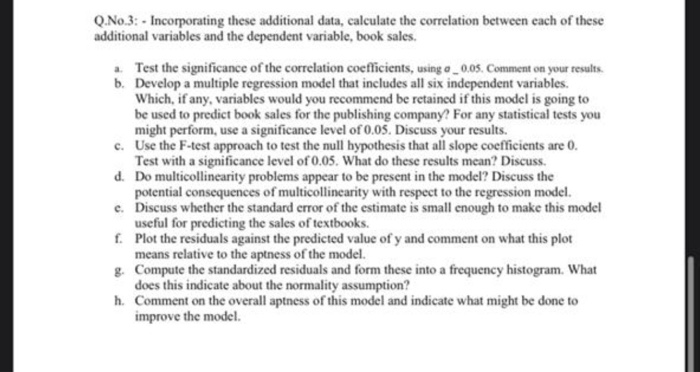
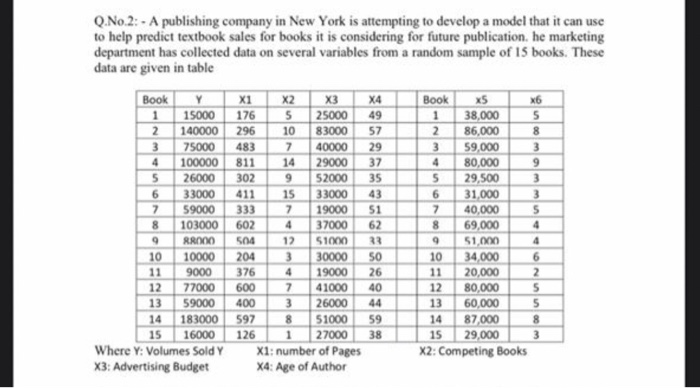
Q.No.3: - Incorporating these additional data, calculate the correlation between each of these additional variables and the dependent variable, book sales. Test the significance of the correlation coefficients, using a _ 0.05. Comment on your results. b. Develop a multiple regression model that includes all six independent variables. Which, if any, variables would you recommend be retained if this model is going to be used to predict book sales for the publishing company? For any statistical tests you might perform, use a significance level of 0.05. Discuss your results. c. Use the F-test approach to test the null hypothesis that all slope coefficients are 0. Test with a significance level of 0.05. What do these results mean? Discuss. d. Do multicollinearity problems appear to be present in the model? Discuss the potential consequences of multicollinearity with respect to the regression model. c. Discuss whether the standard error of the estimate is small enough to make this model useful for predicting the sales of textbooks. f. Plot the residuals against the predicted value of y and comment on what this plot means relative to the aptness of the model. g. Compute the standardized residuals and form these into a frequency histogram. What does this indicate about the normality assumption? h. Comment on the overall aptness of this model and indicate what might be done to improve the model. Q.No.2: - A publishing company in New York is attempting to develop a model that it can use to help predict textbook sales for books it is considering for future publication, he marketing department has collected data on several variables from a random sample of 15 books. These data are given in table Book Y X1 X2 X3 X4 Book x5 X6 1 15000 176 5 25000 49 1 38,000 5 2 140000 296 10 83000 57 2 86,000 8 3 75000 483 7 40000 29 3 59,000 3 4 100000 811 14 29000 37 4 80,000 9 5 26000 302 9 52000 35 5 29,500 3 6 33000 411 15 33000 43 6 31.000 7 59000 333 7 19000 51 7 40,000 5 8 103000 602 4 37000 62 8 69,000 RROOO 504 12 51000 23 51,000 4 10 10000 204 3 30000 50 10 34.000 6 11 9000 376 4 19000 26 11 20,000 2 12 77000 600 7 41000 40 12 80,000 5 13 59000 400 26000 44 13 60,000 5 14 183000 597 8 51000 59 14 87,000 8 15 16000 1 27000 38 15 29,000 3 Where Y: Volumes Sold Y X1: number of Pages X2: Competing Books X3: Advertising Budget X4: Age of Author 9 9 126 Q.No.3: - Incorporating these additional data, calculate the correlation between each of these additional variables and the dependent variable, book sales. Test the significance of the correlation coefficients, using a _ 0.05. Comment on your results. b. Develop a multiple regression model that includes all six independent variables. Which, if any, variables would you recommend be retained if this model is going to be used to predict book sales for the publishing company? For any statistical tests you might perform, use a significance level of 0.05. Discuss your results. c. Use the F-test approach to test the null hypothesis that all slope coefficients are 0. Test with a significance level of 0.05. What do these results mean? Discuss. d. Do multicollinearity problems appear to be present in the model? Discuss the potential consequences of multicollinearity with respect to the regression model. c. Discuss whether the standard error of the estimate is small enough to make this model useful for predicting the sales of textbooks. f. Plot the residuals against the predicted value of y and comment on what this plot means relative to the aptness of the model. g. Compute the standardized residuals and form these into a frequency histogram. What does this indicate about the normality assumption? h. Comment on the overall aptness of this model and indicate what might be done to improve the model. Q.No.2: - A publishing company in New York is attempting to develop a model that it can use to help predict textbook sales for books it is considering for future publication, he marketing department has collected data on several variables from a random sample of 15 books. These data are given in table Book Y X1 X2 X3 X4 Book x5 X6 1 15000 176 5 25000 49 1 38,000 5 2 140000 296 10 83000 57 2 86,000 8 3 75000 483 7 40000 29 3 59,000 3 4 100000 811 14 29000 37 4 80,000 9 5 26000 302 9 52000 35 5 29,500 3 6 33000 411 15 33000 43 6 31.000 7 59000 333 7 19000 51 7 40,000 5 8 103000 602 4 37000 62 8 69,000 RROOO 504 12 51000 23 51,000 4 10 10000 204 3 30000 50 10 34.000 6 11 9000 376 4 19000 26 11 20,000 2 12 77000 600 7 41000 40 12 80,000 5 13 59000 400 26000 44 13 60,000 5 14 183000 597 8 51000 59 14 87,000 8 15 16000 1 27000 38 15 29,000 3 Where Y: Volumes Sold Y X1: number of Pages X2: Competing Books X3: Advertising Budget X4: Age of Author 9 9 126


