Question
Q:Pricing Refer to the discussion of the Chicago-West Coast pricing decision in the case. Should American counter Continental's $159 fare with a relatively-unrestricted discount fare
Q:Pricing
Refer to the discussion of the Chicago-West Coast pricing decision in the case. Should American counter Continental's $159 fare with a relatively-unrestricted discount fare on the nonstop Chicago-West Coast flights?
Chicago-West Coast pricing decision In December 1987 American had to make a pricing decision for its Chicago-West Coast routes. Kevin Short, then manager, Domestic Pricing Strategy, described the decision context:
We served 10 West Coast cities from Chicago: Long Beach, Los Angeles, Ontario, Orange County, Portland, Sacramento, San Diego, San Francisco, San Jose, and Seattle. Our principal competitors were United and Continental. While only United offered competing non-stop flights, both Continental and United operated connecting flights via their Denver huba less circuitous and therefore more convenient routing than our connecting flights via Dallas/Fort Worth.
In the nonstop markets, American and United competed on the basis of fares, flight schedules, and factors such as quality of service. During July-November 1987, for example, both offered a $525 full coach fare and a $177 highly restricted discount fare on the Chicago-San Francisco route.4 Although the two airlines traditionally matched each other's fares, United had taken the initiative in terms of flight schedules: by November 1987, it had begun to offer hourly flights from Chicago to Los Angeles and San Francisco.
In the connecting markets, American, United, and Continental (and other smaller competitors) also competed on the basis of fares and flight schedules. Once again American and United matched each other's fares, while Continental, with its post-Chapter 11 reorganization and low-cost structure, was the low-price provider. On the Chicago-San Francisco route, for example, during July-November 1987, Continental offered a $310 full-coach fare and a $159 discount fare with no restrictions other than capacity control. American and United offered comparable fares on their connecting routings.
So, United had a superior flight schedule, and Continental cheaper fares. As for American, our load factors were down to an unacceptable level. We had to do something. One thing we could do was to offer a relatively unrestricted discount fare on our nonstop Chicago-West Coast flights. Specifically, we had to decide whether to counter Continental's $159 farewith perhaps a small $10-$20 premium and some advance purchase requirement.
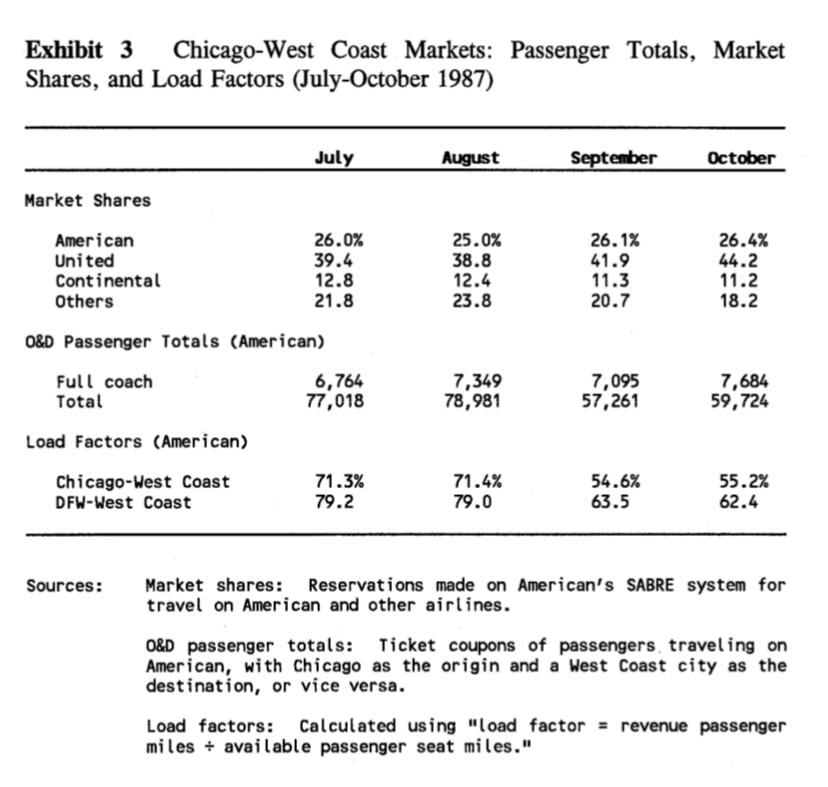
Exhibit 3 gives data on American's passenger totals, market shares, and load factors for the Chicago-West Coast markets during July-October 1987; it also provides American's estimates of its competitors' market shares.

Exhibit 3 Chicago-West Coast Markets: Passenger Totals, Market Shares, and Load Factors (July-October 1987) July August September October Market Shares American 26.0% United 39.4 Continental 12.8 Others 21.8 0&D Passenger Totals (American) 25.0% 38.8 12.4 23.8 26.1% 41.9 11.3 20.7 26.4% 44.2 11.2 18.2. 7,349 Full coach Total 6,764 77,018 7,095 57,261 7,684 59,724 78,981 Load Factors (American) Chicago-West Coast DFW-West Coast 71.3% 79.2 71.4% 79.0 54.6% 63.5 55.2% 62.4 Sources: Market shares: Reservations made on American's SABRE system for travel on American and other airlines. O&D passenger totals: Ticket coupons of passengers traveling on American, with Chicago as the origin and a West Coast city as the destination, or vice versa. Load factors: Calculated using "load factor - revenue passenger miles + available passenger seat miles." Exhibit 3 Chicago-West Coast Markets: Passenger Totals, Market Shares, and Load Factors (July-October 1987) July August September October Market Shares American 26.0% United 39.4 Continental 12.8 Others 21.8 0&D Passenger Totals (American) 25.0% 38.8 12.4 23.8 26.1% 41.9 11.3 20.7 26.4% 44.2 11.2 18.2. 7,349 Full coach Total 6,764 77,018 7,095 57,261 7,684 59,724 78,981 Load Factors (American) Chicago-West Coast DFW-West Coast 71.3% 79.2 71.4% 79.0 54.6% 63.5 55.2% 62.4 Sources: Market shares: Reservations made on American's SABRE system for travel on American and other airlines. O&D passenger totals: Ticket coupons of passengers traveling on American, with Chicago as the origin and a West Coast city as the destination, or vice versa. Load factors: Calculated using "load factor - revenue passenger miles + available passenger seat miles
Step by Step Solution
There are 3 Steps involved in it
Step: 1

Get Instant Access to Expert-Tailored Solutions
See step-by-step solutions with expert insights and AI powered tools for academic success
Step: 2

Step: 3

Ace Your Homework with AI
Get the answers you need in no time with our AI-driven, step-by-step assistance
Get Started


