

Question
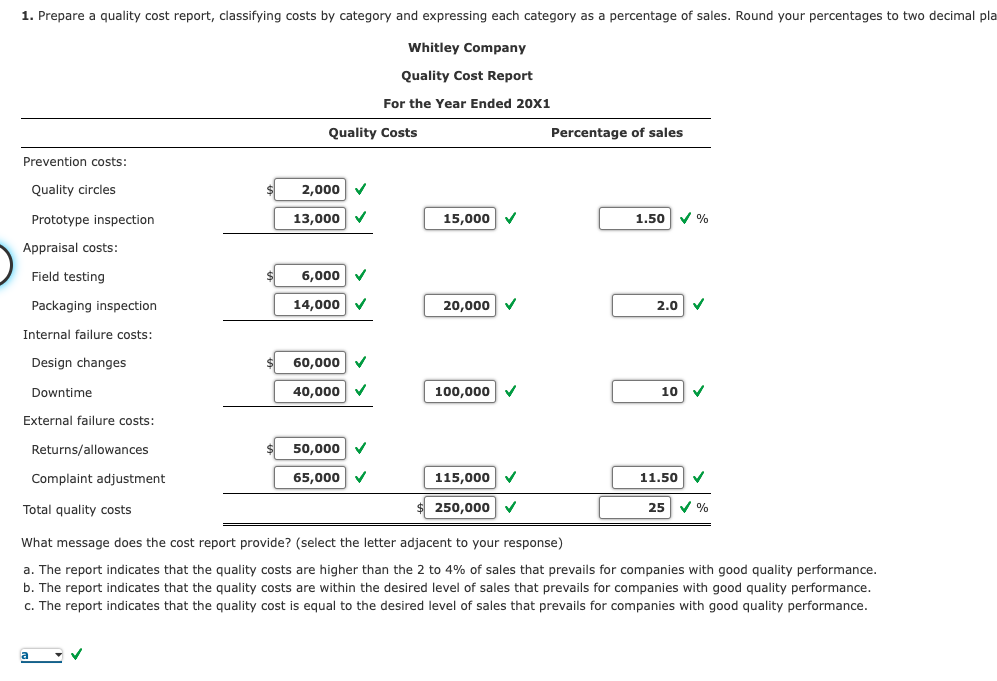
Quality Cost Report Whitley Company had total sales of $1,000,000 for the year ending 20X1. The costs of quality are given below. Returns/allowances $50,000 Design
Quality Cost Report
Whitley Company had total sales of $1,000,000 for the year ending 20X1. The costs of quality are given below.
| Returns/allowances | $50,000 | ||
| Design changes | 60,000 | ||
| Prototype inspection | 13,000 | ||
| Downtime | 40,000 | ||
| Quality circles | 2,000 | ||
| Packaging inspection | 14,000 | ||
| Field testing | 6,000 | ||
| Complaint adjustment | 65,000 |
Required:
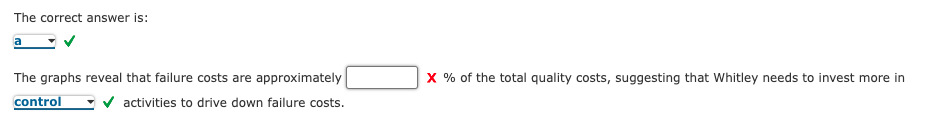
2. Select the letter adjacent to the appropriate bar graph and pie chart which illustrate each categorys contribution to total quality costs.
| a. |
| b. |
| c. |
| d. |
Step by Step Solution
There are 3 Steps involved in it
Step: 1

Get Instant Access to Expert-Tailored Solutions
See step-by-step solutions with expert insights and AI powered tools for academic success
Step: 2

Step: 3
Ace Your Homework with AI
Get the answers you need in no time with our AI-driven, step-by-step assistance
Get Started
Cost Accounting A Managerial Emphasis
Authors: Horngren, Srikant Datar, George Foster, Madhav Rajan, Christ
6th Canadian edition
978-0132893534, 9780133389401, 132893533, 133389405, 978-0133392883