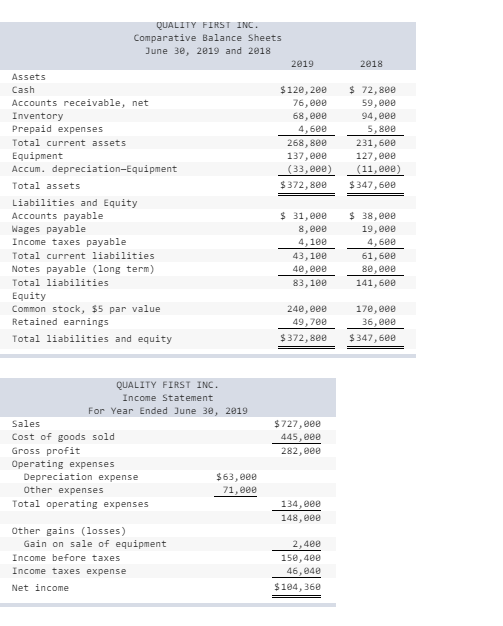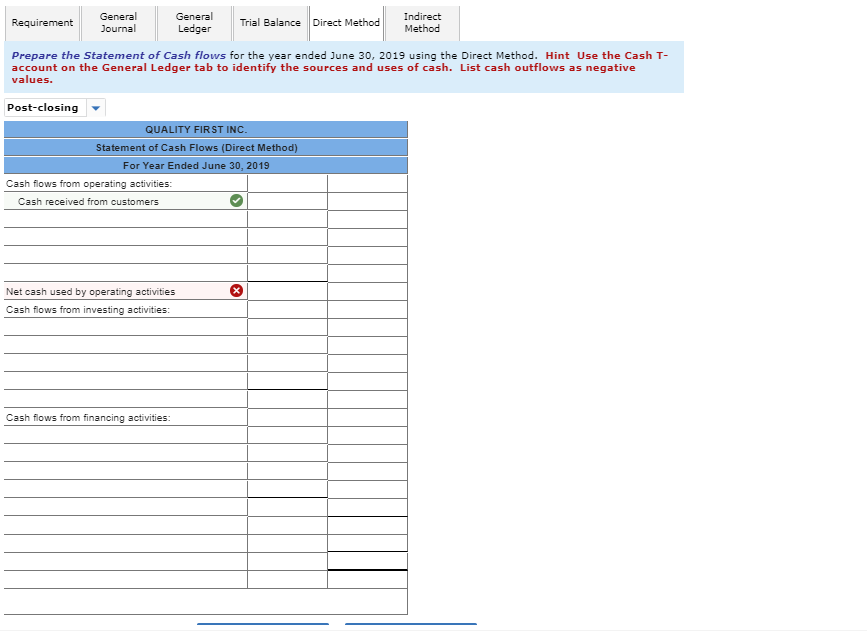

QUALITY FIRST INC. Comparative Balance Sheets June 30, 2019 and 2018 2019 2018 $120, 200 76, eee 68,000 4,682 268,800 137, eee (33,000) $372,800 $ 72,800 59,00 94,000 5,800 231,600 127,000 (11,280) $347,600 Assets Cash Accounts receivable, net Inventory Prepaid expenses Total current assets Equipment Accum. depreciation-Equipment Total assets Liabilities and Equity Accounts payable Wages payable Income taxes payable Total current liabilities Notes payable (long term) Total liabilities Equity Common stock, $5 par value Retained earnings Total liabilities and equity $ 31,200 8, eee 4.100 43,100 40,000 83. 109 $ 38,00 19,00 4.600 61,600 80,000 141,600 240,000 49,700 $372,800 170,000 36.999 $347,600 QUALITY FIRST INC. Income Statement For Year Ended June 30, 2019 Sales Cost of goods sold Gross profit Operating expenses Depreciation expense $63, eee Other expenses 71, eee Total operating expenses $ 727,000 445,00 282, eee 134, 148, eee Other gains (losses) Gain on sale of equipment Income before taxes Income taxes expense Net income 2, 4ee 150, 409 46.840 $184,360 Requirement General Journal General Ledger Trial Balance Direct Method Indirect Method Prepare the Statement of Cash flows for the year ended June 30, 2019 using the Direct Method. Hint Use the Cash T- account on the General Ledger tab to identify the sources and uses of cash. List cash outflows as negative values. Post-closing - QUALITY FIRST INC. Statement of Cash Flows (Direct Method) For Year Ended June 30, 2019 Cash flows from operating activities: Cash received from customers Net cash used by operating activities Cash flows from investing activities: Cash flows from financing activities: QUALITY FIRST INC. Comparative Balance Sheets June 30, 2019 and 2018 2019 2018 $120, 200 76, eee 68,000 4,682 268,800 137, eee (33,000) $372,800 $ 72,800 59,00 94,000 5,800 231,600 127,000 (11,280) $347,600 Assets Cash Accounts receivable, net Inventory Prepaid expenses Total current assets Equipment Accum. depreciation-Equipment Total assets Liabilities and Equity Accounts payable Wages payable Income taxes payable Total current liabilities Notes payable (long term) Total liabilities Equity Common stock, $5 par value Retained earnings Total liabilities and equity $ 31,200 8, eee 4.100 43,100 40,000 83. 109 $ 38,00 19,00 4.600 61,600 80,000 141,600 240,000 49,700 $372,800 170,000 36.999 $347,600 QUALITY FIRST INC. Income Statement For Year Ended June 30, 2019 Sales Cost of goods sold Gross profit Operating expenses Depreciation expense $63, eee Other expenses 71, eee Total operating expenses $ 727,000 445,00 282, eee 134, 148, eee Other gains (losses) Gain on sale of equipment Income before taxes Income taxes expense Net income 2, 4ee 150, 409 46.840 $184,360 Requirement General Journal General Ledger Trial Balance Direct Method Indirect Method Prepare the Statement of Cash flows for the year ended June 30, 2019 using the Direct Method. Hint Use the Cash T- account on the General Ledger tab to identify the sources and uses of cash. List cash outflows as negative values. Post-closing - QUALITY FIRST INC. Statement of Cash Flows (Direct Method) For Year Ended June 30, 2019 Cash flows from operating activities: Cash received from customers Net cash used by operating activities Cash flows from investing activities: Cash flows from financing activities


