quality lab
I need details with answers
plz help me
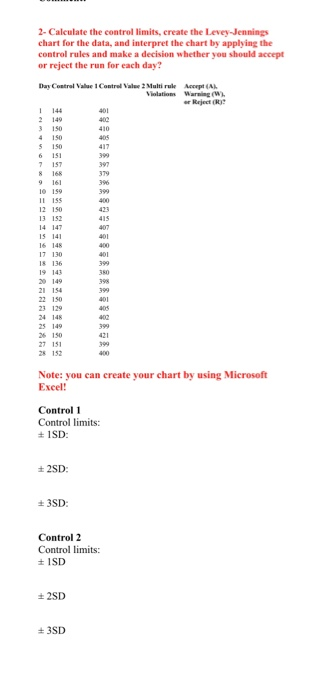
Instrument XYZ was used to measure the alkaline phosphatase concentration in a patient's serum. To make a reliable patient result a daily QC results for alkaline phosphatase normal and abnormal controls were obtained. A two different commercial control products have been selected that have concentrations near the important medical decision levels of 150 U/L and 400 U/L. The results are given in the table below. 2- Calculate the control limits, create the Levey Jennings chart for the data, and interpret the chart by applying the control rules and make a decision whether you should accept or reject the run for each day? Day Control Valor Control Valme ? Multirul Accept Violation Warning (w). Reject 417 390 397 379 396 399 400 4 150 5 150 6 151 7 157 8 168 9 161 10 150 IL 155 12150 13152 14 147 15141 16 14 17130 18 136 19 143 149 21 154 22150 23129 24 14 25 149 26 150 27 151 25 152 415 407 401 400 401 399 380 398 401 405 399 Note: you can create your chart by using Microsoft Excel! Control 1 Control limits: + ISD +2SD 3SD: Control 2 Control limits: ISD 2SD +3SD Instrument XYZ was used to measure the alkaline phosphatase concentration in a patient's serum. To make a reliable patient result a daily QC results for alkaline phosphatase normal and abnormal controls were obtained. A two different commercial control products have been selected that have concentrations near the important medical decision levels of 150 U/L and 400 U/L. The results are given in the table below. 2- Calculate the control limits, create the Levey Jennings chart for the data, and interpret the chart by applying the control rules and make a decision whether you should accept or reject the run for each day? Day Control Valor Control Valme ? Multirul Accept Violation Warning (w). Reject 417 390 397 379 396 399 400 4 150 5 150 6 151 7 157 8 168 9 161 10 150 IL 155 12150 13152 14 147 15141 16 14 17130 18 136 19 143 149 21 154 22150 23129 24 14 25 149 26 150 27 151 25 152 415 407 401 400 401 399 380 398 401 405 399 Note: you can create your chart by using Microsoft Excel! Control 1 Control limits: + ISD +2SD 3SD: Control 2 Control limits: ISD 2SD +3SD