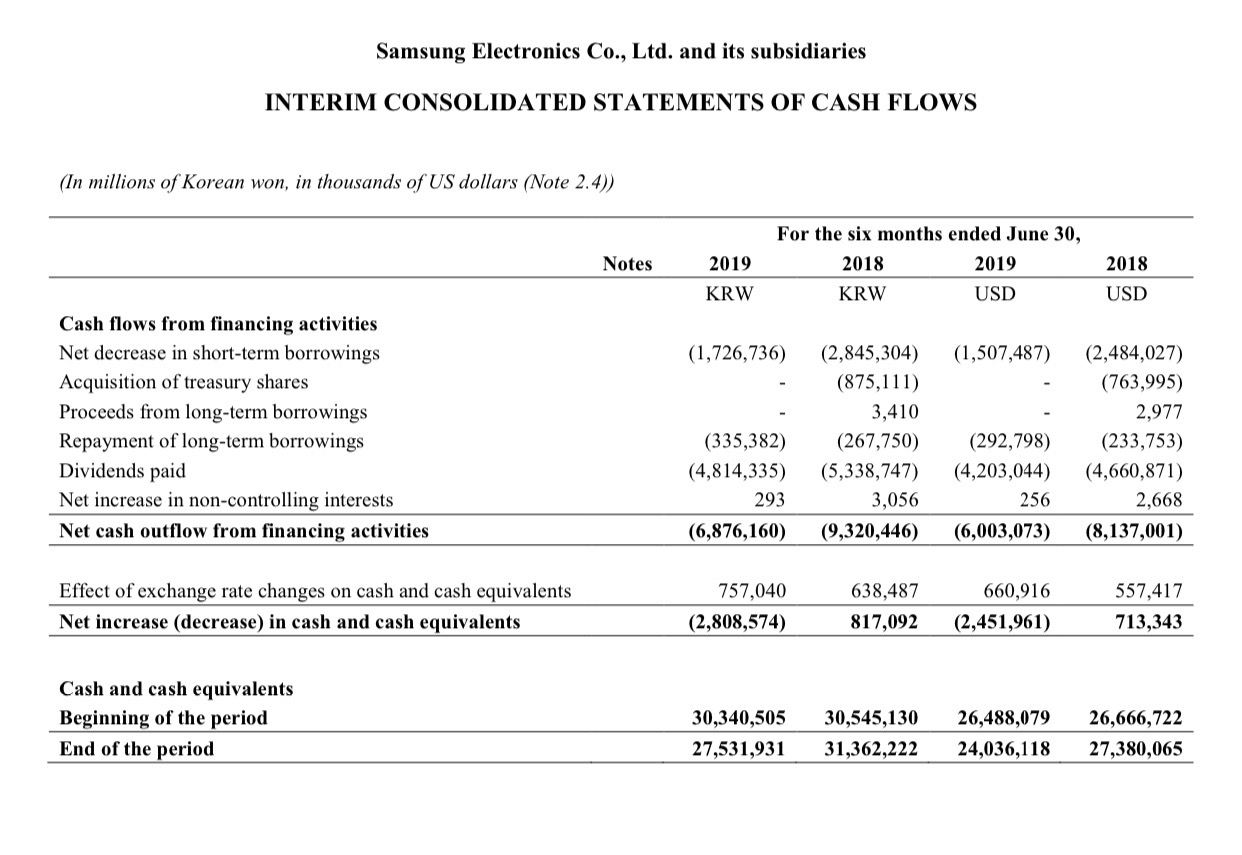
QUANTITATIVE DATA - SAMSUNG
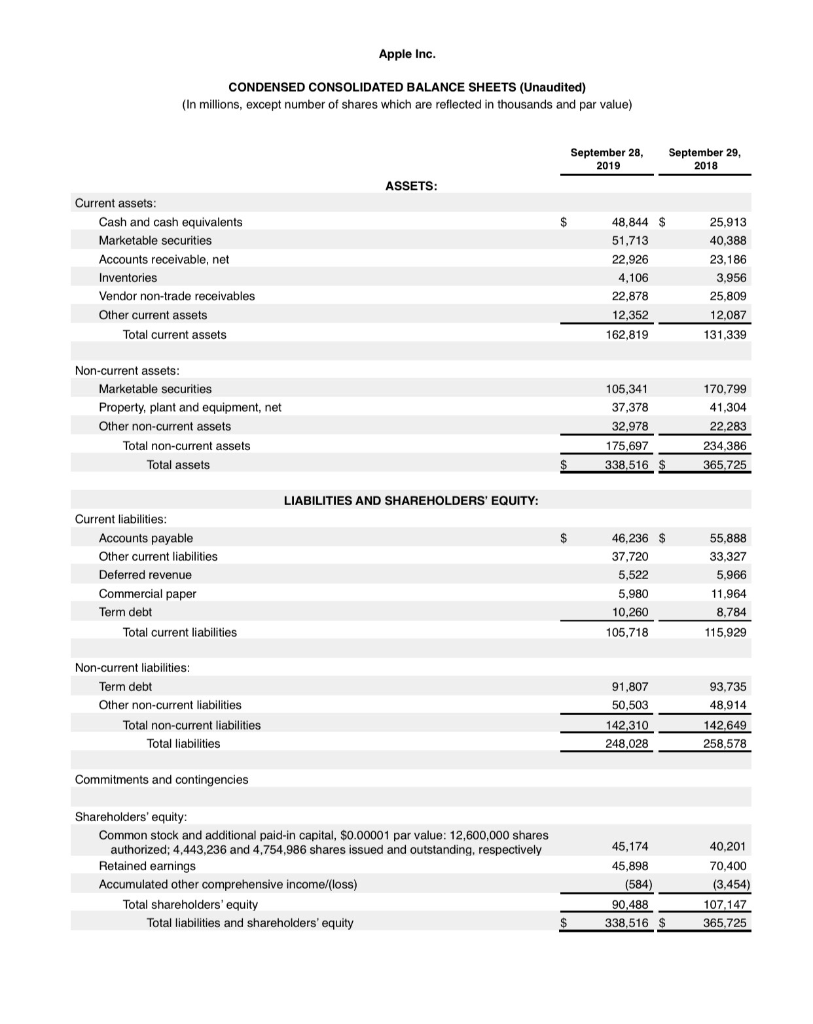
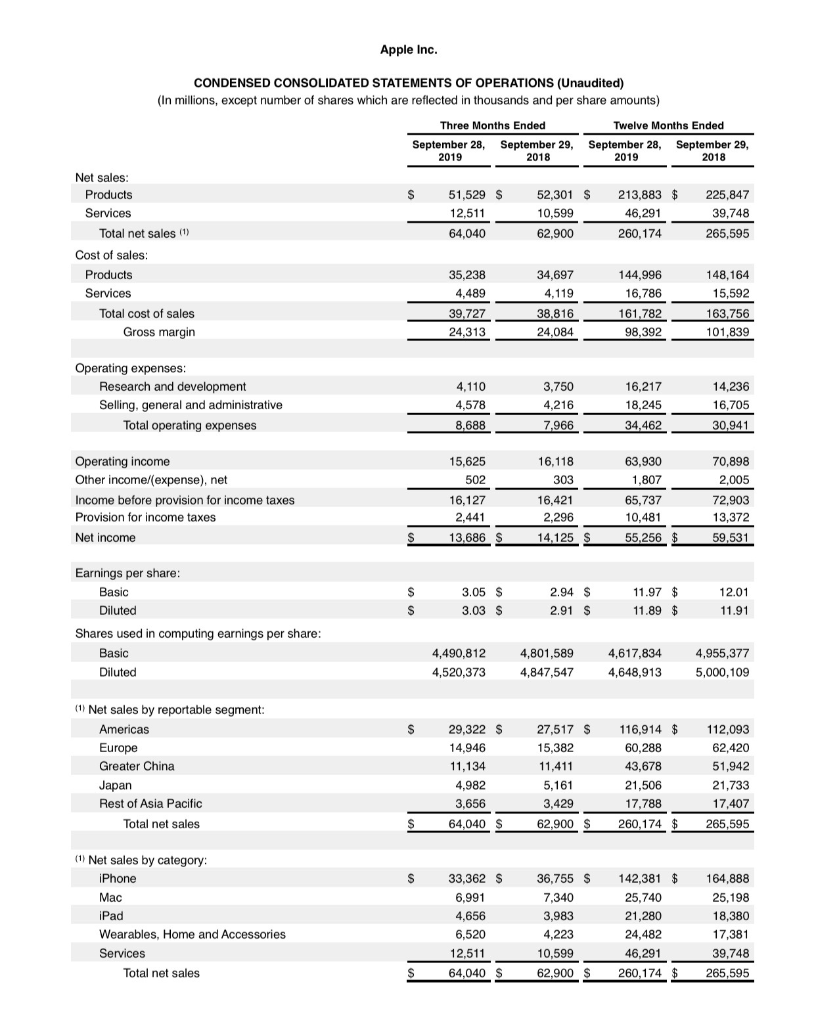
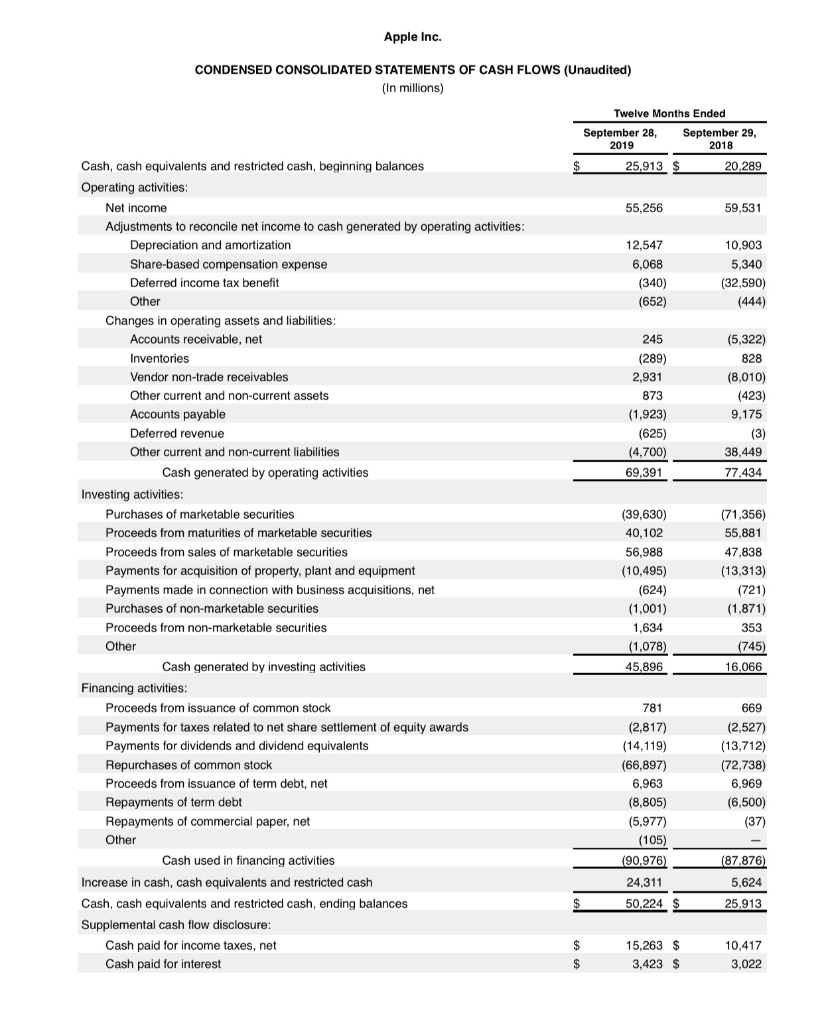
 QUANTITATIVE DATA - APPLE
 PLEASE BE VERY DETAILED WHEN ANSWERING . ENSURE QUESTIONS ARE ANSWERED EFFICIENTLY AND EFFECTIVELY.
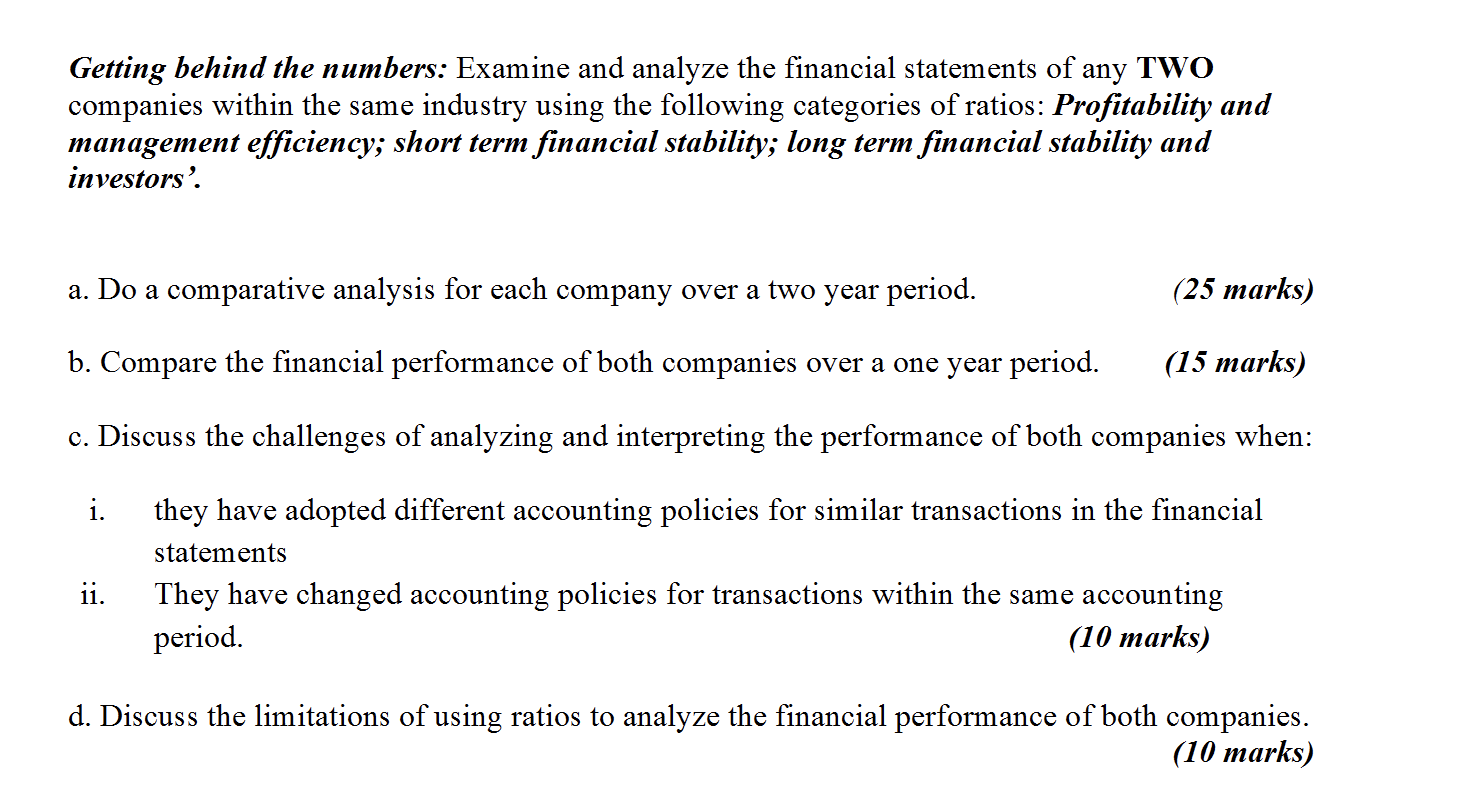
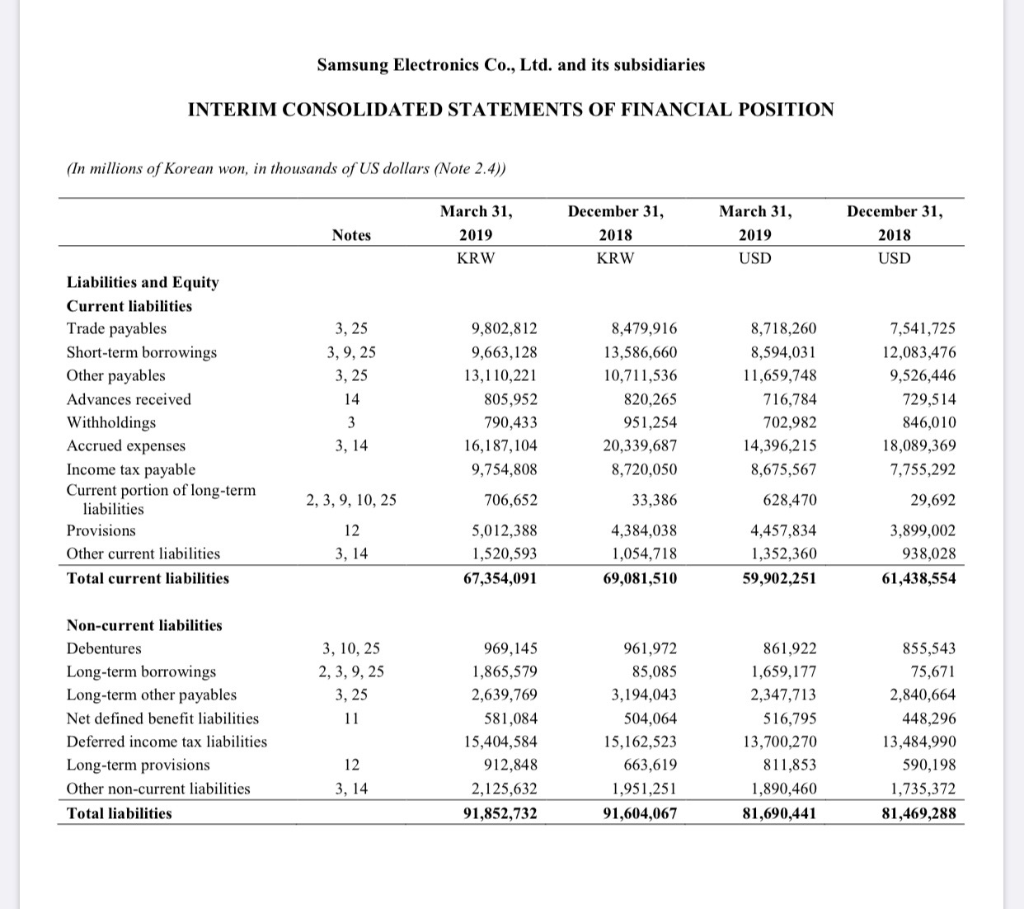
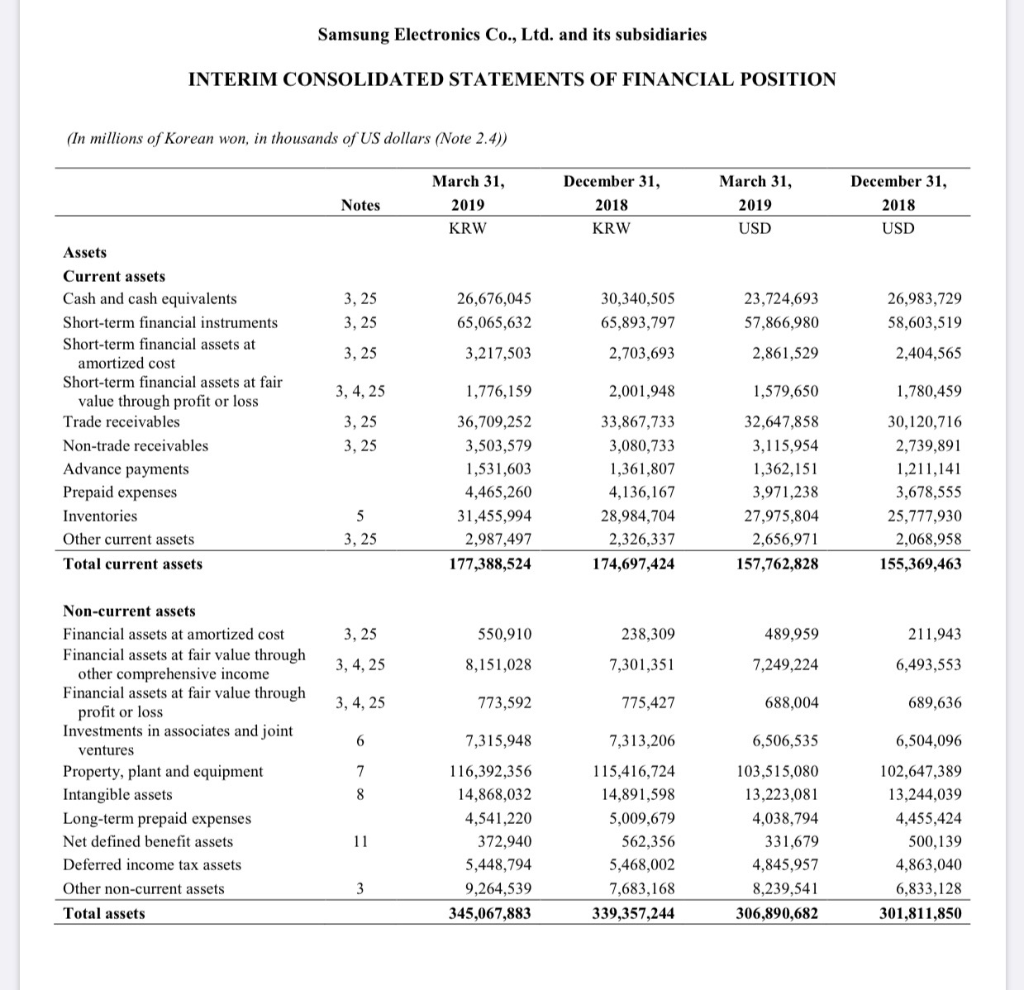
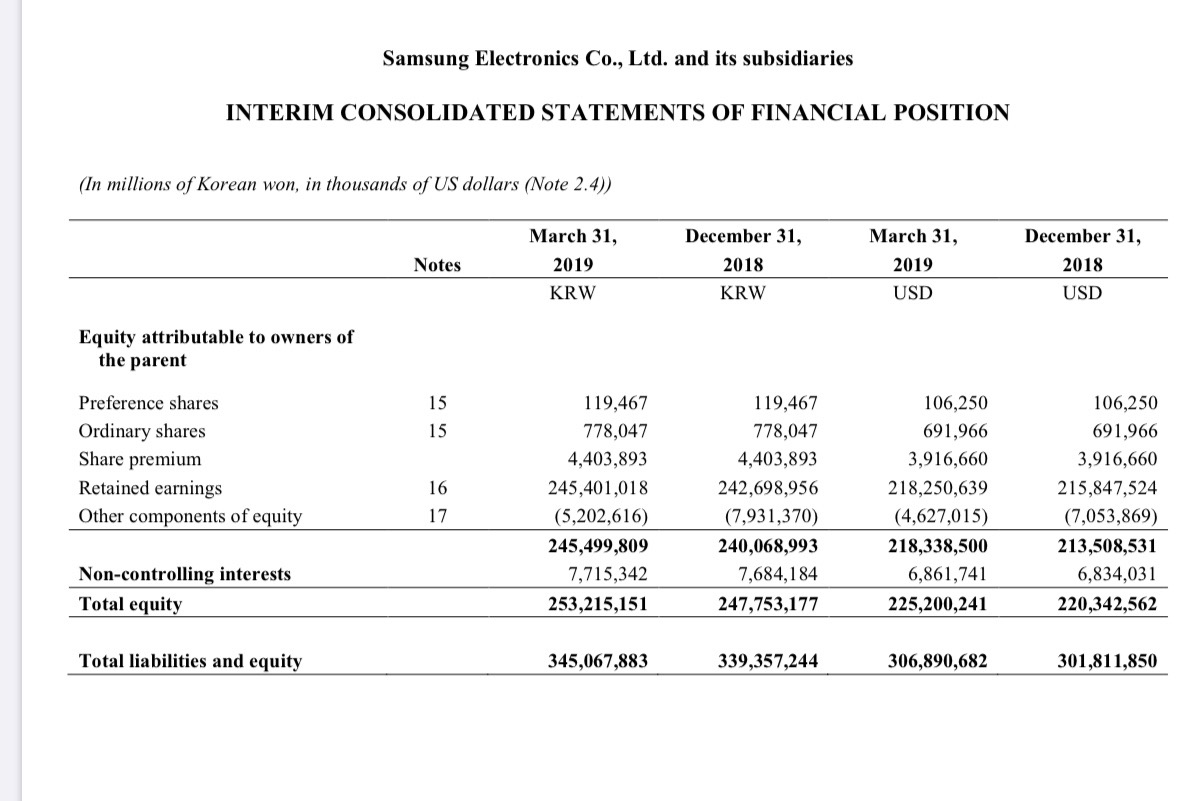
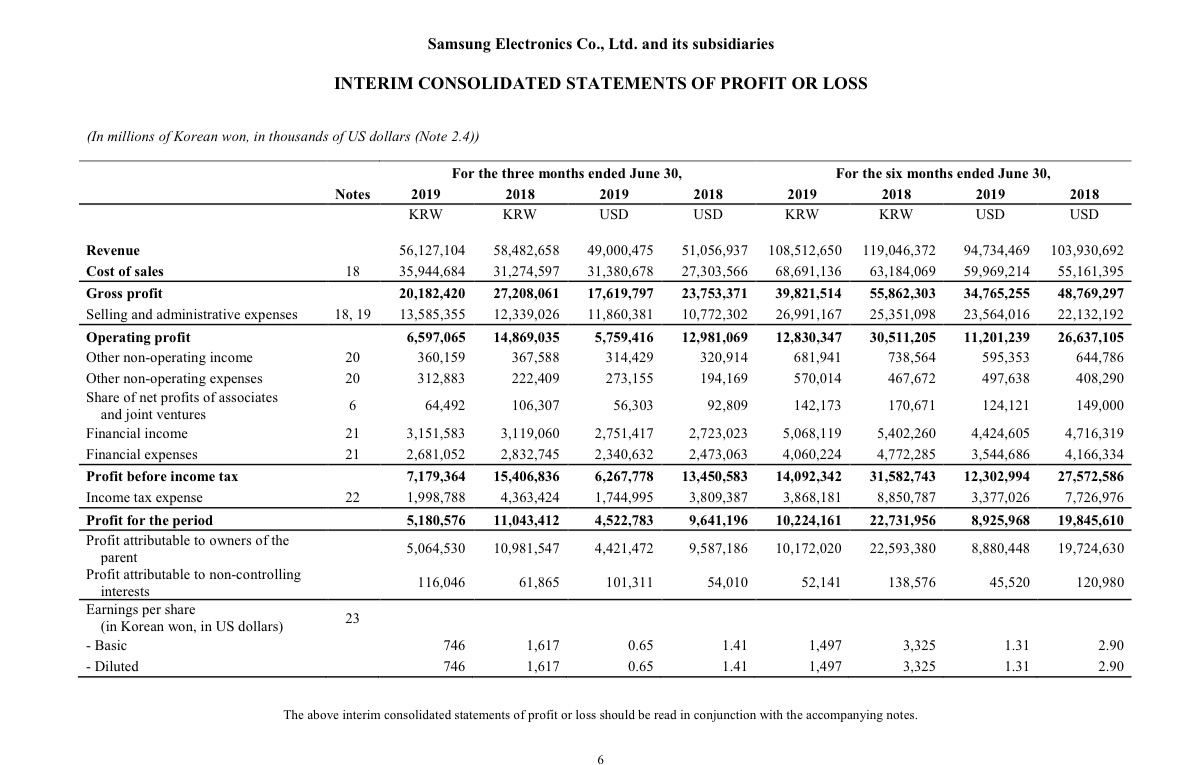
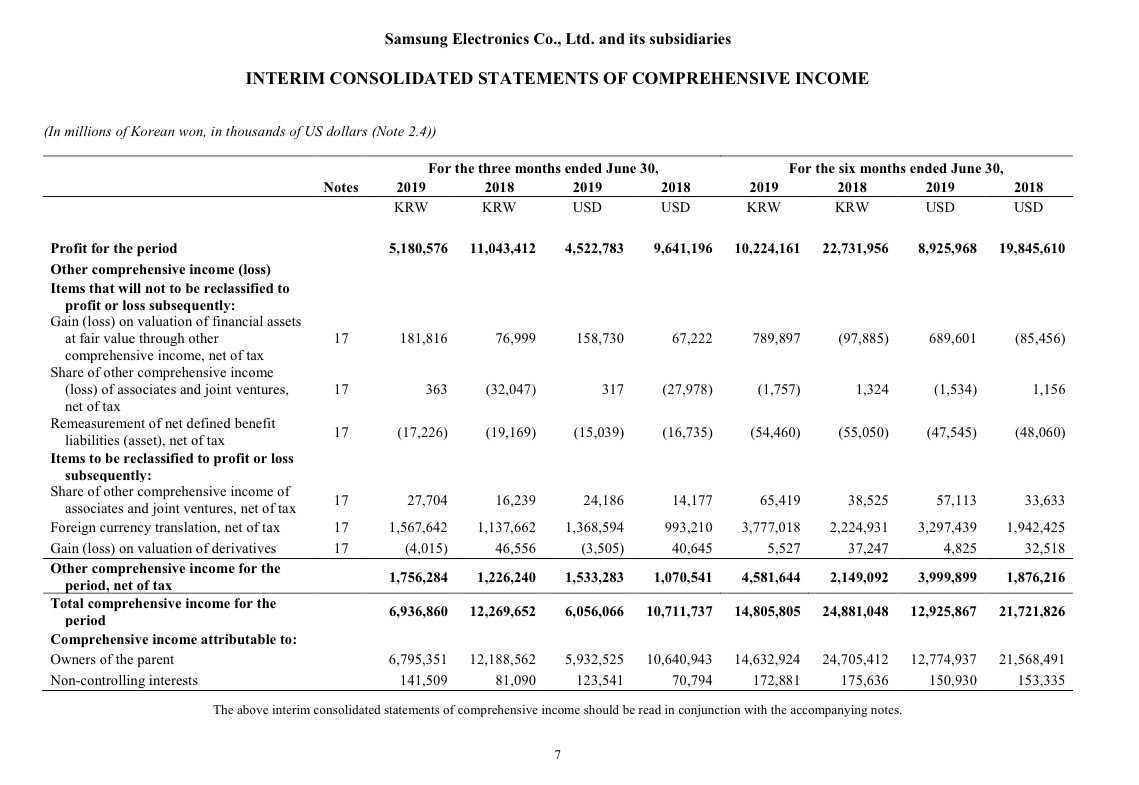
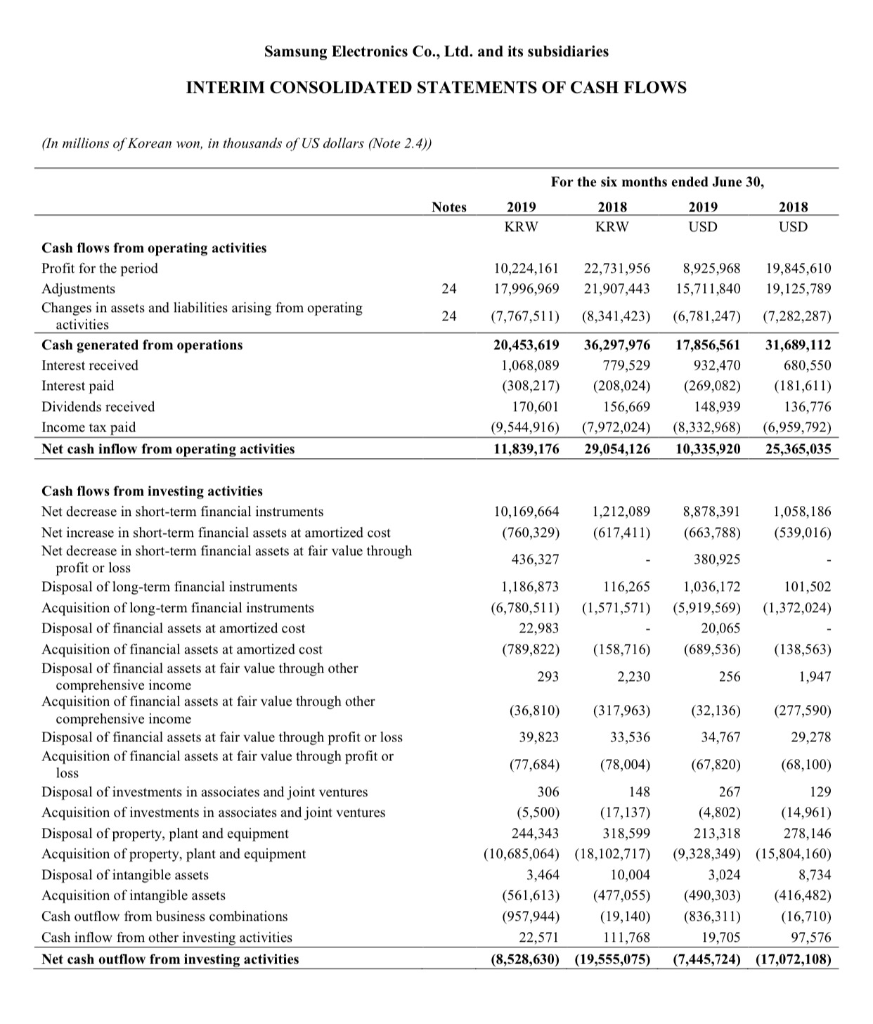
Getting behind the numbers: Examine and analyze the financial statements of any TW0 companies within the same industry using the following categories of ratios: Profitability and management efficiency; short term financial stability; long term financial stability and investors' a. Do a comparative analysis for each company over a two year period (25 marks) b. Compare the financial performance of both companies over a one year period (15 marks) c. Discuss the challenges of analyzing and interpreting the performance of both companies when: i. they have adopted different accounting policies for similar transactions in the financial statements ii They have changed accounting policies for transactions within the same accounting period (10 marks) d. Discuss the limitations of using ratios to analyze the financial performance of both companies. (10 marks) Samsung Electronics Co., Ltd. and its subsidiaries INTERIM CONSOLIDATED STATEMENTS OF FINANCIAL POSITION (In millions of Korean won, in thousands of US dollars (Note 2.4)) December 31, March 31, December 31, March 31, Notes 2019 2018 2019 2018 KRW KRW USD USD Liabilities and Equity Current liabilities Trade payables 9,802,812 3, 25 8,479,916 8,718,260 7,541,725 9,663,128 Short-term borrowings Other payables 3, 9, 25 13,586,660 8,594,031 12,083,476 10,711,536 9,526,446 13,110,221 11,659,748 3, 25 Advances received 14 805,952 820,265 716,784 729,514 846,010 Withholdings Accrued expenses 951,254 3 790,433 702,982 14,396,215 3, 14 16,187,104 20,339,687 18,089,369 Income tax payable Current portion of long-term liabilities 8,720,050 9,754,808 8,675,567 7,755,292 2, 3,9, 10, 25 628,470 706,652 33,386 29,692 Provisions 12 5,012,388 4,384,038 4,457,834 3,899,002 Other current liabilities 3, 14 1,520,593 1,054,718 1,352,360 938,028 Total current liabilities 67,354,091 69,081,510 59,902,251 61,438,554 Non-current liabilities 961.972 Debentures 3, 10, 25 861,922 855,543 969,145 Long-term borrowings Long-term other payables 2, 3,9, 25 1,865,579 75,671 85,085 1,659,177 2,639,769 3, 25 3,194,043 2,347,713 2,840,664 Net defined benefit liabilities 504,064 516,795 448,296 11 581,084 13,700,270 13,484,990 Deferred income tax liabilities 15,162,523 15,404,584 Long-term provisions 12 912,848 663,619 811,853 590,198 3, 14 Other non-current liabilities 2,125,632 1,890,460 1,735,372 1,951,251 Total liabilities 91,852,732 91,604,067 81,690,441 81,469,288 Samsung Electronics Co., Ltd. and its subsidiaries INTERIM CONSOLIDATED STATEMENTS OF CASH FLOWS (In millions of Korean won, in thousands of US dollars (Note 2.4)) For the six months ended June 30, Notes 2019 2018 2019 2018 USD USD KRW KRW Cash flows from operating activities Profit for the period 10,224,16 22,731,956 19,845,610 8,925,968 Adjustments Changes in assets and liabilities arising from operating activities 24 17,996,969 21,907,443 15,711,840 19,125,789 (6,781,247) (7,282,287) 24 (7,767,511) (8,341,423) Cash generated from operations 31,689,112 20,453,619 36,297,976 17,856,561 Interest received 1,068,089 779,529 932,470 680,550 Interest paid (181,611 (308,217) (208,024) (269,082) 136,776 Dividends received 170,601 156,669 148,939 Income tax paid (9,544,916) (7,972,024) (8,332,968) (6,959,792) 29,054,126 Net cash inflow from operating activities 11,839,176 10,335,920 25,365,035 Cash flows from investing activities 1,058,186 Net decrease in short-term financial instruments 10,169,664 1,212,089 8,878,391 (539,016 Net increase in short-term financial assets at amortized cost (760,329) (617,411) (663,788) Net decrease in short-term financial assets at fair value through profit or loss Disposal of long-term financial instruments Acquisition of long-term financial instruments Disposal of financial assets at amortized cost 436,327 380,925 1,186,873 116,265 1,036,172 101,502 (6,780,511) (1,571,571) (5,919,569) (1,372,024) 22,983 20,065 (789,822 (158,716) Acquisition of financial assets at amortized cost (689,536) (138,563) Disposal of financial assets at fair value through other comprehensive income Acquisition of financial assets at fair value through other comprehensive income Disposal of financial assets at fair value through profit or loss Acquisition of financial assets at fair value through profit or oss 293 2,230 256 1,947 (36,810) (317,963) (32,136) (277,590) 34,767 39,823 33,536 29,278 (68,100 (78,004) (77,684) (67,820) Disposal of investments in associates and joint ventures 267 129 306 148 (17,137) (4,802) Acquisition of investments in associates and joint ventures (5,500) (14,961 244,343 Disposal of property, plant and equipment 318,599 213,318 278,146 Acquisition of property, plant and equipment Disposal of intangible assets (10,685,064) 18,102,717) (9,328,349) 15,804,160) 3,464 10,004 3,024 8,734 (477,055) (490,303) Acquisition of intangible assets (561,613) (416,482) (957,944) (16,710) Cash outflow from business combinations (19,140) (836,311 Cash inflow from other investing activities 22,571 19,705 111,768 97,576 Net cash outflow from investing activities (8,528,630) (19,555,075) (7,445,724) (17,072,1 08) Samsung Electronics Co., Ltd. and its subsidiaries INTERIM CONSOLIDATED STATEMENTS OF CASH FLOWS (In millions of Korean won, in thousands of US dollars (Note 2.4)) For the six months ended June 30, 2018 Notes 2019 2018 2019 KRW KRW USD USD Cash flows from financing activities Net decrease in short-term borrowings (2,845,304) (1,507,487) (1,726,736) (2,484,027) Acquisition of treasury shares (875,111 (763,995) Proceeds from long-term borrowings 3,410 2,977 Repayment of long-term borrowings Dividends paid (335,382) (267,750) (292,798) (233,753) (4,814,335 (5,338,747) (4,203,044) (4,660,871) Net increase in non-controlling interests 293 3,056 256 2,668 Net cash outflow from financing activities (6,876,160) (9,320,446) (6,003,073) (8,137,001) Effect of exchange rate changes on cash and cash equivalents 757,040 638,487 660,916 557,417 Net increase (decrease) in cash and cash equivalents (2,808,574) 817,092 (2,451,961) 713,343 Cash and cash equivalents Beginning of the period 30,340,505 30,545,130 26,488,079 26,666,722 End of the period 27,531,931 31,362,222 24,036,118 27,380,065 Getting behind the numbers: Examine and analyze the financial statements of any TW0 companies within the same industry using the following categories of ratios: Profitability and management efficiency; short term financial stability; long term financial stability and investors' a. Do a comparative analysis for each company over a two year period (25 marks) b. Compare the financial performance of both companies over a one year period (15 marks) c. Discuss the challenges of analyzing and interpreting the performance of both companies when: i. they have adopted different accounting policies for similar transactions in the financial statements ii They have changed accounting policies for transactions within the same accounting period (10 marks) d. Discuss the limitations of using ratios to analyze the financial performance of both companies. (10 marks) Samsung Electronics Co., Ltd. and its subsidiaries INTERIM CONSOLIDATED STATEMENTS OF FINANCIAL POSITION (In millions of Korean won, in thousands of US dollars (Note 2.4)) December 31, March 31, December 31, March 31, Notes 2019 2018 2019 2018 KRW KRW USD USD Liabilities and Equity Current liabilities Trade payables 9,802,812 3, 25 8,479,916 8,718,260 7,541,725 9,663,128 Short-term borrowings Other payables 3, 9, 25 13,586,660 8,594,031 12,083,476 10,711,536 9,526,446 13,110,221 11,659,748 3, 25 Advances received 14 805,952 820,265 716,784 729,514 846,010 Withholdings Accrued expenses 951,254 3 790,433 702,982 14,396,215 3, 14 16,187,104 20,339,687 18,089,369 Income tax payable Current portion of long-term liabilities 8,720,050 9,754,808 8,675,567 7,755,292 2, 3,9, 10, 25 628,470 706,652 33,386 29,692 Provisions 12 5,012,388 4,384,038 4,457,834 3,899,002 Other current liabilities 3, 14 1,520,593 1,054,718 1,352,360 938,028 Total current liabilities 67,354,091 69,081,510 59,902,251 61,438,554 Non-current liabilities 961.972 Debentures 3, 10, 25 861,922 855,543 969,145 Long-term borrowings Long-term other payables 2, 3,9, 25 1,865,579 75,671 85,085 1,659,177 2,639,769 3, 25 3,194,043 2,347,713 2,840,664 Net defined benefit liabilities 504,064 516,795 448,296 11 581,084 13,700,270 13,484,990 Deferred income tax liabilities 15,162,523 15,404,584 Long-term provisions 12 912,848 663,619 811,853 590,198 3, 14 Other non-current liabilities 2,125,632 1,890,460 1,735,372 1,951,251 Total liabilities 91,852,732 91,604,067 81,690,441 81,469,288 Samsung Electronics Co., Ltd. and its subsidiaries INTERIM CONSOLIDATED STATEMENTS OF CASH FLOWS (In millions of Korean won, in thousands of US dollars (Note 2.4)) For the six months ended June 30, Notes 2019 2018 2019 2018 USD USD KRW KRW Cash flows from operating activities Profit for the period 10,224,16 22,731,956 19,845,610 8,925,968 Adjustments Changes in assets and liabilities arising from operating activities 24 17,996,969 21,907,443 15,711,840 19,125,789 (6,781,247) (7,282,287) 24 (7,767,511) (8,341,423) Cash generated from operations 31,689,112 20,453,619 36,297,976 17,856,561 Interest received 1,068,089 779,529 932,470 680,550 Interest paid (181,611 (308,217) (208,024) (269,082) 136,776 Dividends received 170,601 156,669 148,939 Income tax paid (9,544,916) (7,972,024) (8,332,968) (6,959,792) 29,054,126 Net cash inflow from operating activities 11,839,176 10,335,920 25,365,035 Cash flows from investing activities 1,058,186 Net decrease in short-term financial instruments 10,169,664 1,212,089 8,878,391 (539,016 Net increase in short-term financial assets at amortized cost (760,329) (617,411) (663,788) Net decrease in short-term financial assets at fair value through profit or loss Disposal of long-term financial instruments Acquisition of long-term financial instruments Disposal of financial assets at amortized cost 436,327 380,925 1,186,873 116,265 1,036,172 101,502 (6,780,511) (1,571,571) (5,919,569) (1,372,024) 22,983 20,065 (789,822 (158,716) Acquisition of financial assets at amortized cost (689,536) (138,563) Disposal of financial assets at fair value through other comprehensive income Acquisition of financial assets at fair value through other comprehensive income Disposal of financial assets at fair value through profit or loss Acquisition of financial assets at fair value through profit or oss 293 2,230 256 1,947 (36,810) (317,963) (32,136) (277,590) 34,767 39,823 33,536 29,278 (68,100 (78,004) (77,684) (67,820) Disposal of investments in associates and joint ventures 267 129 306 148 (17,137) (4,802) Acquisition of investments in associates and joint ventures (5,500) (14,961 244,343 Disposal of property, plant and equipment 318,599 213,318 278,146 Acquisition of property, plant and equipment Disposal of intangible assets (10,685,064) 18,102,717) (9,328,349) 15,804,160) 3,464 10,004 3,024 8,734 (477,055) (490,303) Acquisition of intangible assets (561,613) (416,482) (957,944) (16,710) Cash outflow from business combinations (19,140) (836,311 Cash inflow from other investing activities 22,571 19,705 111,768 97,576 Net cash outflow from investing activities (8,528,630) (19,555,075) (7,445,724) (17,072,1 08) Samsung Electronics Co., Ltd. and its subsidiaries INTERIM CONSOLIDATED STATEMENTS OF CASH FLOWS (In millions of Korean won, in thousands of US dollars (Note 2.4)) For the six months ended June 30, 2018 Notes 2019 2018 2019 KRW KRW USD USD Cash flows from financing activities Net decrease in short-term borrowings (2,845,304) (1,507,487) (1,726,736) (2,484,027) Acquisition of treasury shares (875,111 (763,995) Proceeds from long-term borrowings 3,410 2,977 Repayment of long-term borrowings Dividends paid (335,382) (267,750) (292,798) (233,753) (4,814,335 (5,338,747) (4,203,044) (4,660,871) Net increase in non-controlling interests 293 3,056 256 2,668 Net cash outflow from financing activities (6,876,160) (9,320,446) (6,003,073) (8,137,001) Effect of exchange rate changes on cash and cash equivalents 757,040 638,487 660,916 557,417 Net increase (decrease) in cash and cash equivalents (2,808,574) 817,092 (2,451,961) 713,343 Cash and cash equivalents Beginning of the period 30,340,505 30,545,130 26,488,079 26,666,722 End of the period 27,531,931 31,362,222 24,036,118 27,380,065