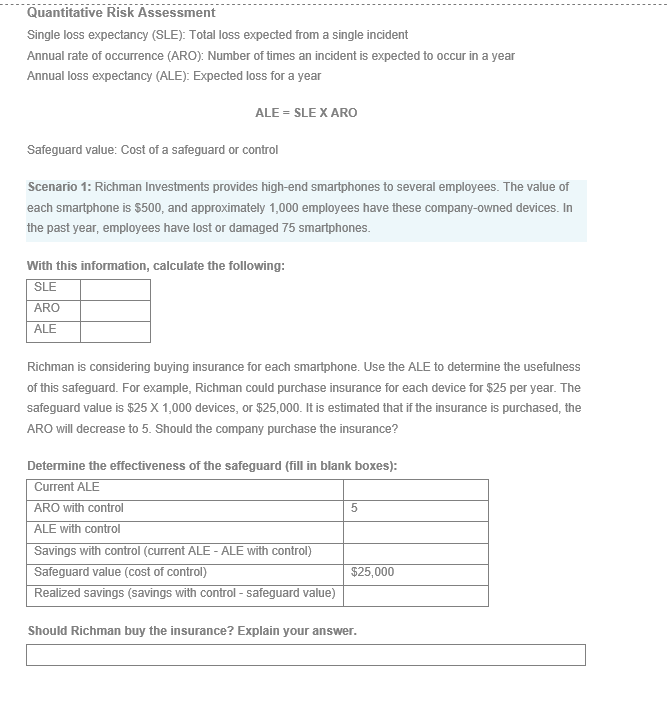
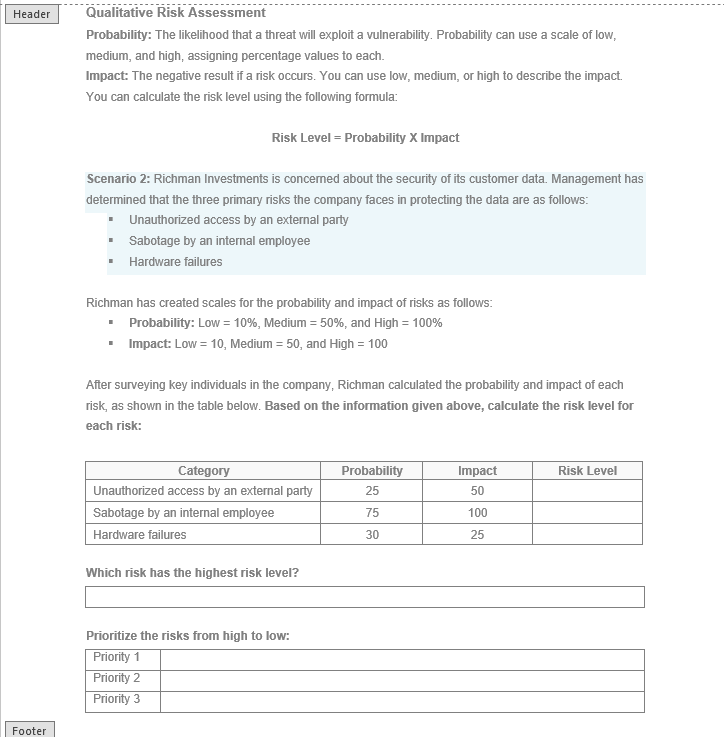
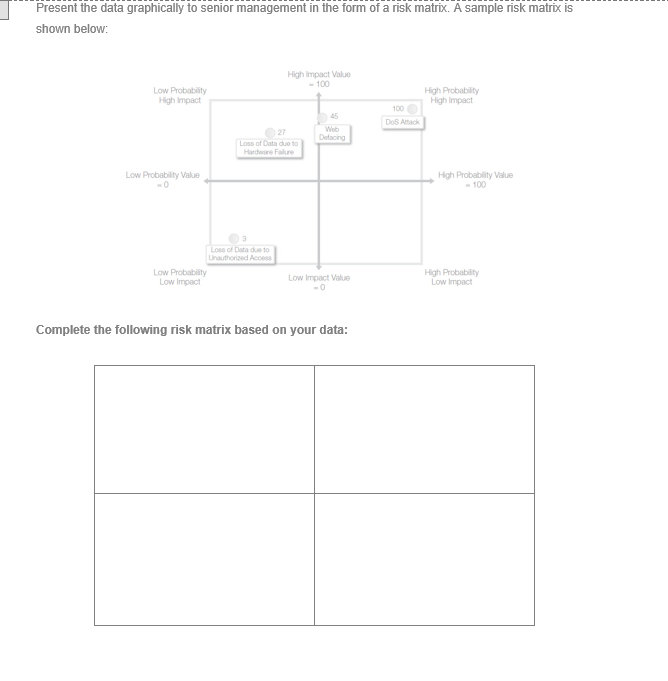
Quantitative Risk Assessment Single loss expectancy (SLE): Total loss expected from a single incident Annual rate of occurrence (ARO): Number of times an incident is expected to occur in a year Annual loss expectancy (ALE): Expected loss for a year ALE = SLE X ARO Safeguard value: Cost of a safeguard or control Scenario 1: Richman Investments provides high-end smartphones to several employees. The value of each smartphone is $500, and approximately 1,000 employees have these company-owned devices. In the past year, employees have lost or damaged 75 smartphones. With this information, calculate the following: SLE ARO ALE Richman is considering buying insurance for each smartphone. Use the ALE to determine the usefulness of this safeguard. For example, Richman could purchase insurance for each device for $25 per year. The safeguard value is $25 X 1,000 devices, or $25,000. It is estimated that if the insurance is purchased, the ARO will decrease to 5. Should the company purchase the insurance? Determine the effectiveness of the safeguard (fill in blank boxes): Current ALE ARO with control ALE with control Savings with control (current ALE - ALE with control) Safeguard value (cost of control) $25,000 Realized savings (savings with control - safeguard value) Should Richman buy the insurance? Explain your answer. Header Qualitative Risk Assessment Probability: The likelihood that a threat will exploit a vulnerability. Probability can use a scale of low, medium, and high, assigning percentage values to each. Impact: The negative result if a risk occurs. You can use low, medium, or high to describe the impact. You can calculate the risk level using the following formula: Risk Level = Probability X Impact Scenario 2: Richman Investments is concerned about the security of its customer data. Management has determined that the three primary risks the company faces in protecting the data are as follows: . Unauthorized access by an external party . Sabotage by an internal employee Hardware failures Richman has created scales for the probability and impact of risks as follows: . Probability: Low = 10%, Medium = 50%, and High = 100% Impact: Low = 10, Medium = 50, and High = 100 After surveying key individuals in the company, Richman calculated the probability and impact of each risk, as shown in the table below. Based on the information given above, calculate the risk level for each risk: Risk Level Category Unauthorized access by an external party Sabotage by an internal employee Hardware failures Probability 25 75 30 Impact 50 100 25 Which risk has the highest risk level? Prioritize the risks from high to low: Priority 1 Priority 2 Priority 3 Footer Present the data graphically to senior management in the form of a risk matrix. A sample risk matrix is shown below: High Impact Value -100 Low Probability High Impact High Probability High Impact 100 Dos Amack Dong 27 Loss of Data due to Hardware Low Probability Value High Probability Value Loss Data do Low Probability Low Impact Low Impact Value High Probability Low Impact Complete the following risk matrix based on your data: Quantitative Risk Assessment Single loss expectancy (SLE): Total loss expected from a single incident Annual rate of occurrence (ARO): Number of times an incident is expected to occur in a year Annual loss expectancy (ALE): Expected loss for a year ALE = SLE X ARO Safeguard value: Cost of a safeguard or control Scenario 1: Richman Investments provides high-end smartphones to several employees. The value of each smartphone is $500, and approximately 1,000 employees have these company-owned devices. In the past year, employees have lost or damaged 75 smartphones. With this information, calculate the following: SLE ARO ALE Richman is considering buying insurance for each smartphone. Use the ALE to determine the usefulness of this safeguard. For example, Richman could purchase insurance for each device for $25 per year. The safeguard value is $25 X 1,000 devices, or $25,000. It is estimated that if the insurance is purchased, the ARO will decrease to 5. Should the company purchase the insurance? Determine the effectiveness of the safeguard (fill in blank boxes): Current ALE ARO with control ALE with control Savings with control (current ALE - ALE with control) Safeguard value (cost of control) $25,000 Realized savings (savings with control - safeguard value) Should Richman buy the insurance? Explain your answer. Header Qualitative Risk Assessment Probability: The likelihood that a threat will exploit a vulnerability. Probability can use a scale of low, medium, and high, assigning percentage values to each. Impact: The negative result if a risk occurs. You can use low, medium, or high to describe the impact. You can calculate the risk level using the following formula: Risk Level = Probability X Impact Scenario 2: Richman Investments is concerned about the security of its customer data. Management has determined that the three primary risks the company faces in protecting the data are as follows: . Unauthorized access by an external party . Sabotage by an internal employee Hardware failures Richman has created scales for the probability and impact of risks as follows: . Probability: Low = 10%, Medium = 50%, and High = 100% Impact: Low = 10, Medium = 50, and High = 100 After surveying key individuals in the company, Richman calculated the probability and impact of each risk, as shown in the table below. Based on the information given above, calculate the risk level for each risk: Risk Level Category Unauthorized access by an external party Sabotage by an internal employee Hardware failures Probability 25 75 30 Impact 50 100 25 Which risk has the highest risk level? Prioritize the risks from high to low: Priority 1 Priority 2 Priority 3 Footer Present the data graphically to senior management in the form of a risk matrix. A sample risk matrix is shown below: High Impact Value -100 Low Probability High Impact High Probability High Impact 100 Dos Amack Dong 27 Loss of Data due to Hardware Low Probability Value High Probability Value Loss Data do Low Probability Low Impact Low Impact Value High Probability Low Impact Complete the following risk matrix based on your data