

Answered step by step
Verified Expert Solution
Question
1 Approved Answer
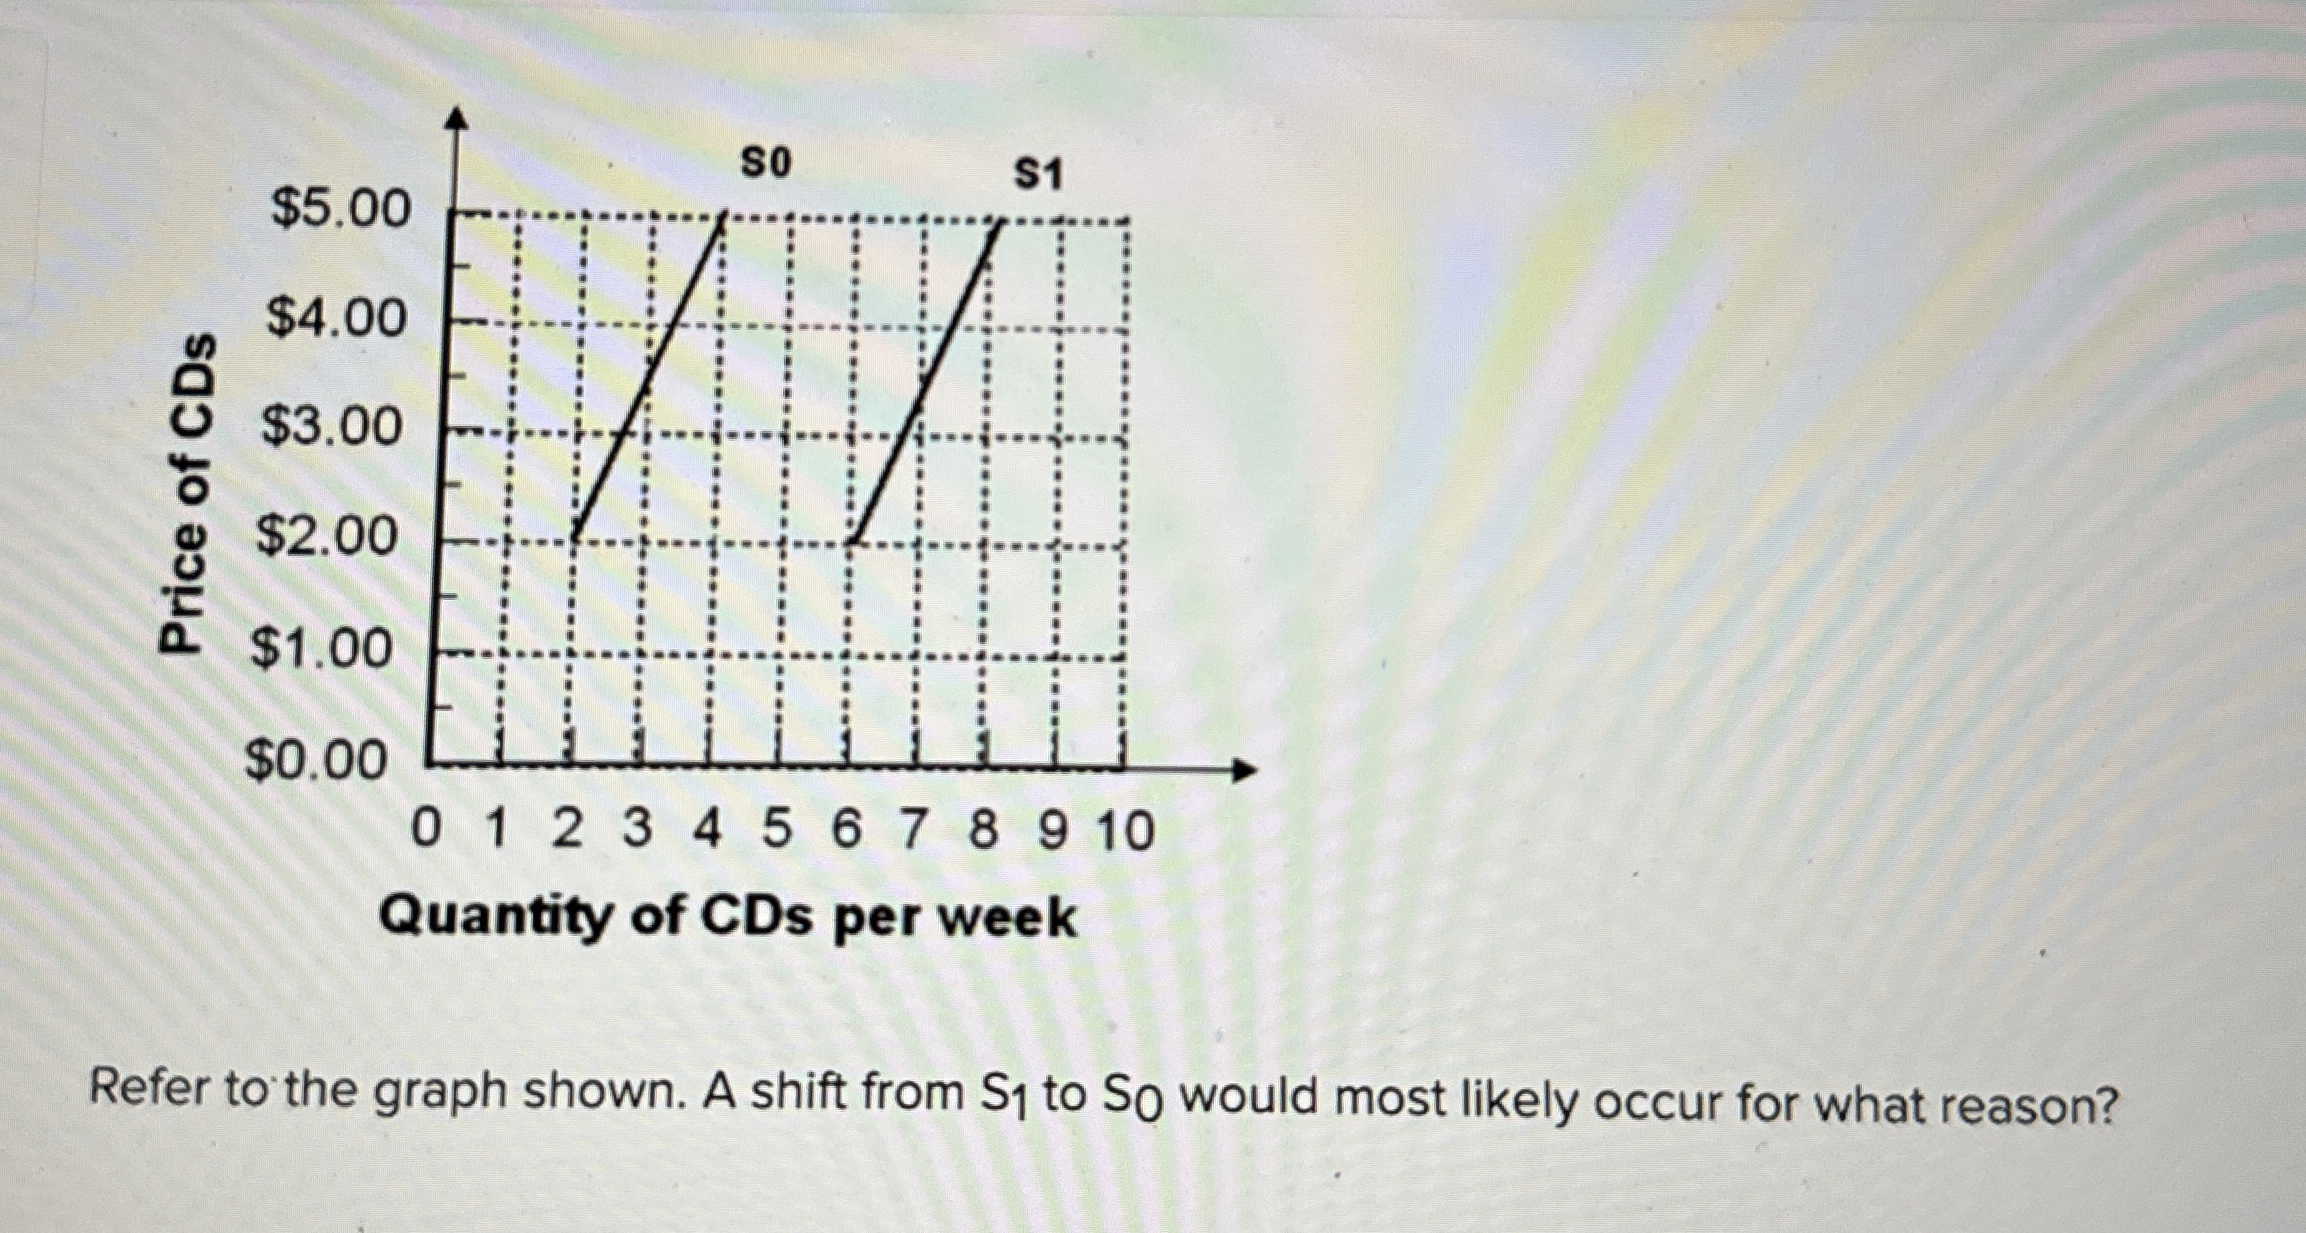
Quantity of CDs per week Refer to the graph shown. A shift from S 1 to S 0 would most likely occur for what reason?
Quantity of CDs per week
Refer to the graph shown. A shift from to would most likely occur for what reason?
Step by Step Solution
There are 3 Steps involved in it
Step: 1

Get Instant Access to Expert-Tailored Solutions
See step-by-step solutions with expert insights and AI powered tools for academic success
Step: 2

Step: 3
Ace Your Homework with AI
Get the answers you need in no time with our AI-driven, step-by-step assistance
Get Started
Applied Econometric Time Series
Authors: Walter Enders
4th Edition
1118808568, 9781118808566