Answered step by step
Verified Expert Solution
Link Copied!

Question

1 Approved Answer

Queation Completion Status Select the box-and-whisker plot that represents the following data. 0 20 20 22 23 24 26 27 30 30 31 31 33
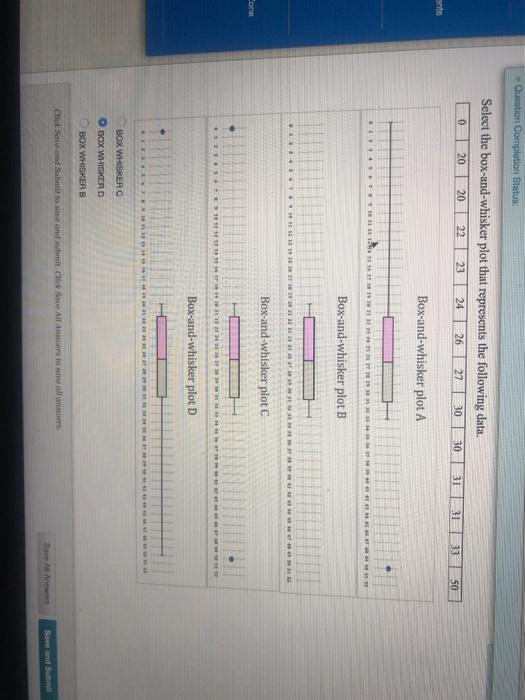
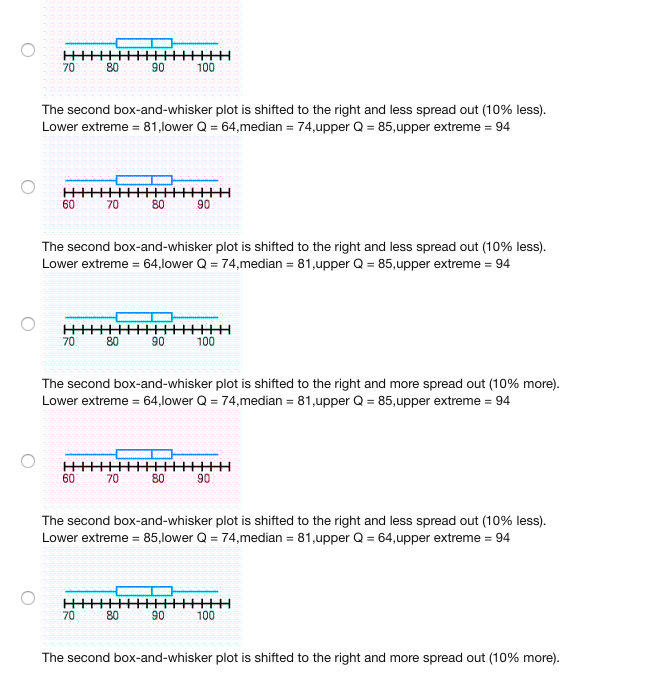
image text in transcribedimage text in transcribedimage text in transcribedimage text in transcribed
Queation Completion Status Select the box-and-whisker plot that represents the following data. 0 20 20 22 23 24 26 27 30 30 31 31 33 50 Box-and-whisker plot A Box-and-whisker plot B Box-and-whisker plot C Box-and-whisker plot D BOX WHISKER C GOX WHISKER D BOX WHISKER EO 70 80 90 100 The second box-and-whisker plot is shifted to the right and less spread out (10% less). Lower extreme = 81, lower Q = 64,median = 74,upper Q = 85, upper extreme = 94 O 60 70 80 90 The second box-and-whisker plot is shifted to the right and less spread out (10% less). Lower extreme = 64,lower Q = 74,median = 81,upper Q = 85, upper extreme = 94 O 80 90 100 The second box-and-whisker plot is shifted to the right and more spread out (10% more). Lower extreme = 64,lower Q = 74,median = 81,upper Q = 85, upper extreme = 94 O 60 70 90 The second box-and-whisker plot is shifted to the right and less spread out (10% less). Lower extreme = 85,lower Q = 74,median = 81,upper Q = 64,upper extreme = 94 O 70 90 100 The second box-and-whisker plot is shifted to the right and more spread out (10% more).The Chi-squared test has been used earlier to test a hypothesis about a population variance. It is also a hypothesis testing procedure for when one or more variables in the research are categorical (nominal). During this week, we are covering the following two such Chi-squared tests: . Chi-squared Goodness of Fit Test . Chi-squared Test for Independency Describe why the Chi-squared tests of the types mentioned above are always right-tailed hypothesis testing problems.12.2.23 Question Help Explain the differences between the chi-square test for independence and the chi-square test for homogeneity. What are the similarities? The difference is that the chi-square test for independence compares | one characteristic from one population and the chi-square test for homogeneity compares two characteristics from one population. one characteristic two characteristics

Step by Step Solution

There are 3 Steps involved in it

Step: 1

blur-text-image

Get Instant Access to Expert-Tailored Solutions

See step-by-step solutions with expert insights and AI powered tools for academic success

Step: 2

blur-text-image_2

Step: 3

blur-text-image_3

Ace Your Homework with AI

Get the answers you need in no time with our AI-driven, step-by-step assistance

Get Started

Recommended Textbook for

Advanced Engineering Mathematics

Authors: ERWIN KREYSZIG

9th Edition

0471488852, 978-0471488859

More Books

Students also viewed these Mathematics questions