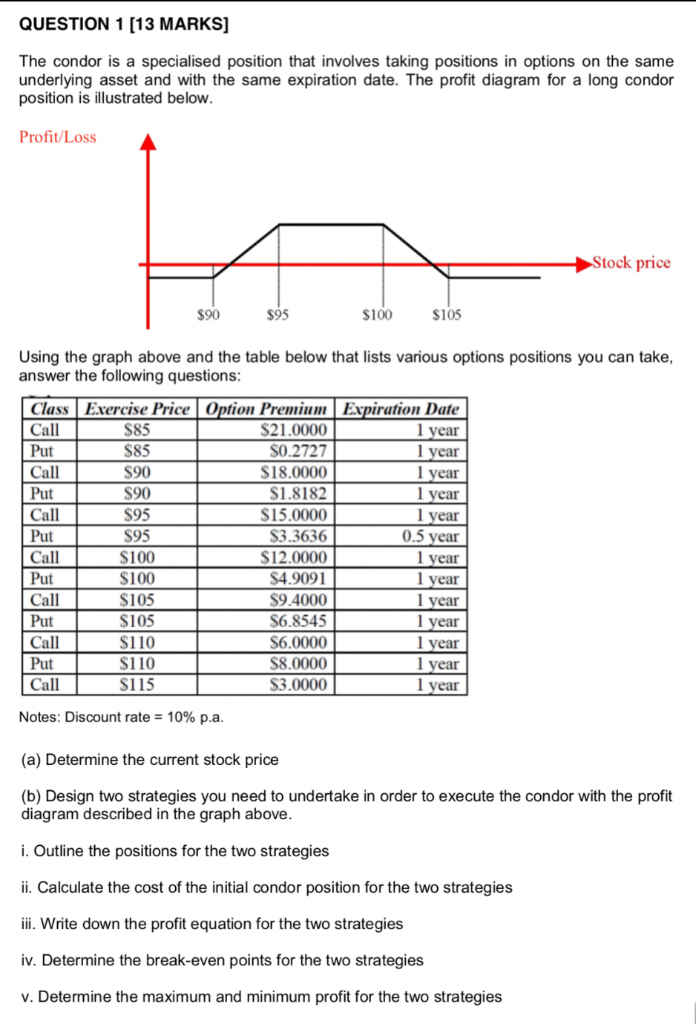
QUESTION 1 [13 MARKS] The condor is a specialised position that invol ves taking positions in options on the same underlying asset and with the same expiration date. The profit diagram for a long condor position is illustrated below. Profit/Loss Stock price $95 $105 $90 $100 Using the graph above and the table below that lists various options positions you can take, answer the following questions: Class | Exercise Price | Option Premium | Expiration Date 1 year 1 year l year 1 year l year 0.5 year 1 year Call $85 $21.0000 $0.2727 $18.0000 $1.8182 $15.0000 $3.3636 Put $85 Call $90 $90 Put Call $95 $95 Put Call $12.0000 $4.9091 $100 Put $100 year Call $105 $105 $9.4000 year $6.8545 Put l year Call $110 $6.0000 year Put $110 $8.0000 year I year $115 Call S3.0000 Notes: Discount rate = 10% p.a. (a) Determine the current stock price (b) Design two strategies you need to undertake in order to execute the condor with the profit diagram described in the graph above i. Outline the positions for the two strategies ii. Calculate the cost of the initial condor position for the two strategies ii. Write down the profit equation for the two strategies iv. Determine the break-even points for the two strategies v. Determine the maximum and minimum profit for the two strategies QUESTION 1 [13 MARKS] The condor is a specialised position that invol ves taking positions in options on the same underlying asset and with the same expiration date. The profit diagram for a long condor position is illustrated below. Profit/Loss Stock price $95 $105 $90 $100 Using the graph above and the table below that lists various options positions you can take, answer the following questions: Class | Exercise Price | Option Premium | Expiration Date 1 year 1 year l year 1 year l year 0.5 year 1 year Call $85 $21.0000 $0.2727 $18.0000 $1.8182 $15.0000 $3.3636 Put $85 Call $90 $90 Put Call $95 $95 Put Call $12.0000 $4.9091 $100 Put $100 year Call $105 $105 $9.4000 year $6.8545 Put l year Call $110 $6.0000 year Put $110 $8.0000 year I year $115 Call S3.0000 Notes: Discount rate = 10% p.a. (a) Determine the current stock price (b) Design two strategies you need to undertake in order to execute the condor with the profit diagram described in the graph above i. Outline the positions for the two strategies ii. Calculate the cost of the initial condor position for the two strategies ii. Write down the profit equation for the two strategies iv. Determine the break-even points for the two strategies v. Determine the maximum and minimum profit for the two strategies


