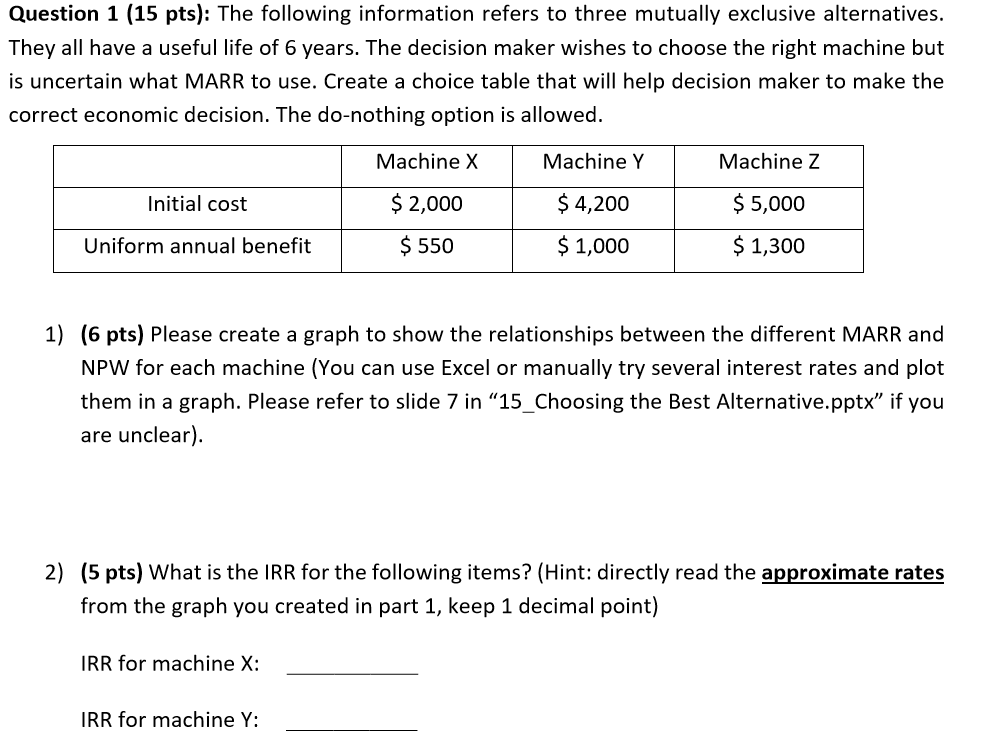
Question 1 (15 pts): The following information refers to three mutually exclusive alternatives. They all have a useful life of 6 years. The decision maker wishes to choose the right machine but is uncertain what MARR to use. Create a choice table that will help decision maker to make the correct economic decision. The do-nothing option is allowed. Machine X Machine Y Machine Z Initial cost $ 2,000 $ 4,200 $5,000 Uniform annual benefit $ 550 $ 1,000 $ 1,300 1) (6 pts) Please create a graph to show the relationships between the different MARR and NPW for each machine (You can use Excel or manually try several interest rates and plot them in a graph. Please refer to slide 7 in "15 Choosing the Best Alternative.pptx" if you are unclear). 2) (5 pts) What is the IRR for the following items? (Hint: directly read the approximate rates from the graph you created in part 1, keep 1 decimal point) IRR for machine X: IRR for machine Y: IRR for machine Y: IRR for machine Z: IRR for machine Y-X, i.e., AIRRY-x: IRR for machine Z-X, i.e., AIRRz-x: ) (2 pts) Create a choice table (use the approximate rates you got in part 2). Page 1 of 2 ) (2 pts) The decision maker later decides to use a MARR of 12%, which alternative should be selected? Please use one sentence to justify your answer. Question 1 (15 pts): The following information refers to three mutually exclusive alternatives. They all have a useful life of 6 years. The decision maker wishes to choose the right machine but is uncertain what MARR to use. Create a choice table that will help decision maker to make the correct economic decision. The do-nothing option is allowed. Machine X Machine Y Machine Z Initial cost $ 2,000 $ 4,200 $5,000 Uniform annual benefit $ 550 $ 1,000 $ 1,300 1) (6 pts) Please create a graph to show the relationships between the different MARR and NPW for each machine (You can use Excel or manually try several interest rates and plot them in a graph. Please refer to slide 7 in "15 Choosing the Best Alternative.pptx" if you are unclear). 2) (5 pts) What is the IRR for the following items? (Hint: directly read the approximate rates from the graph you created in part 1, keep 1 decimal point) IRR for machine X: IRR for machine Y: IRR for machine Y: IRR for machine Z: IRR for machine Y-X, i.e., AIRRY-x: IRR for machine Z-X, i.e., AIRRz-x: ) (2 pts) Create a choice table (use the approximate rates you got in part 2). Page 1 of 2 ) (2 pts) The decision maker later decides to use a MARR of 12%, which alternative should be selected? Please use one sentence to justify your