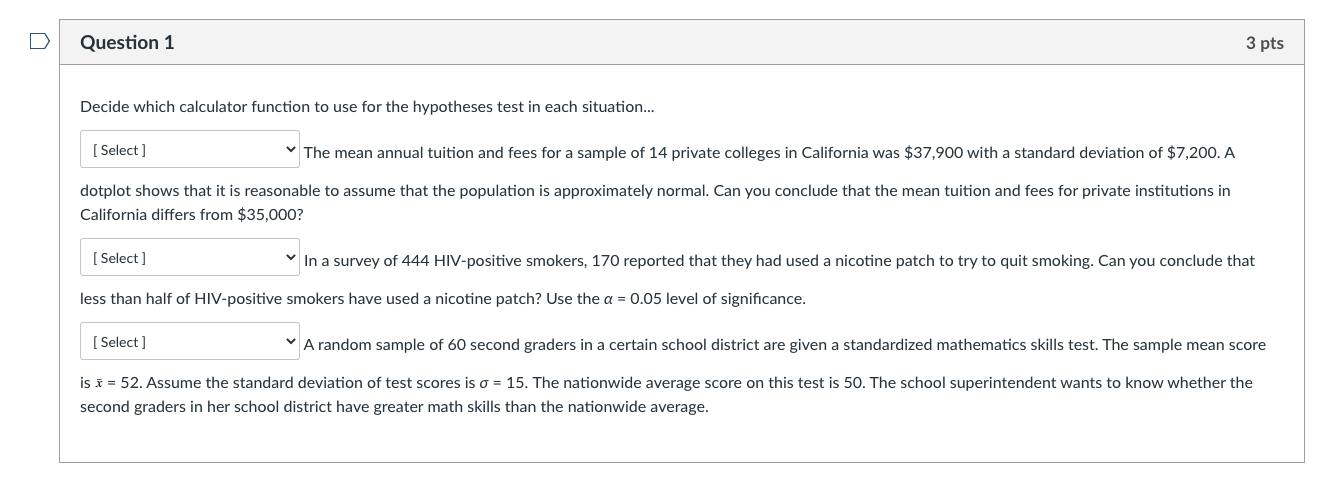
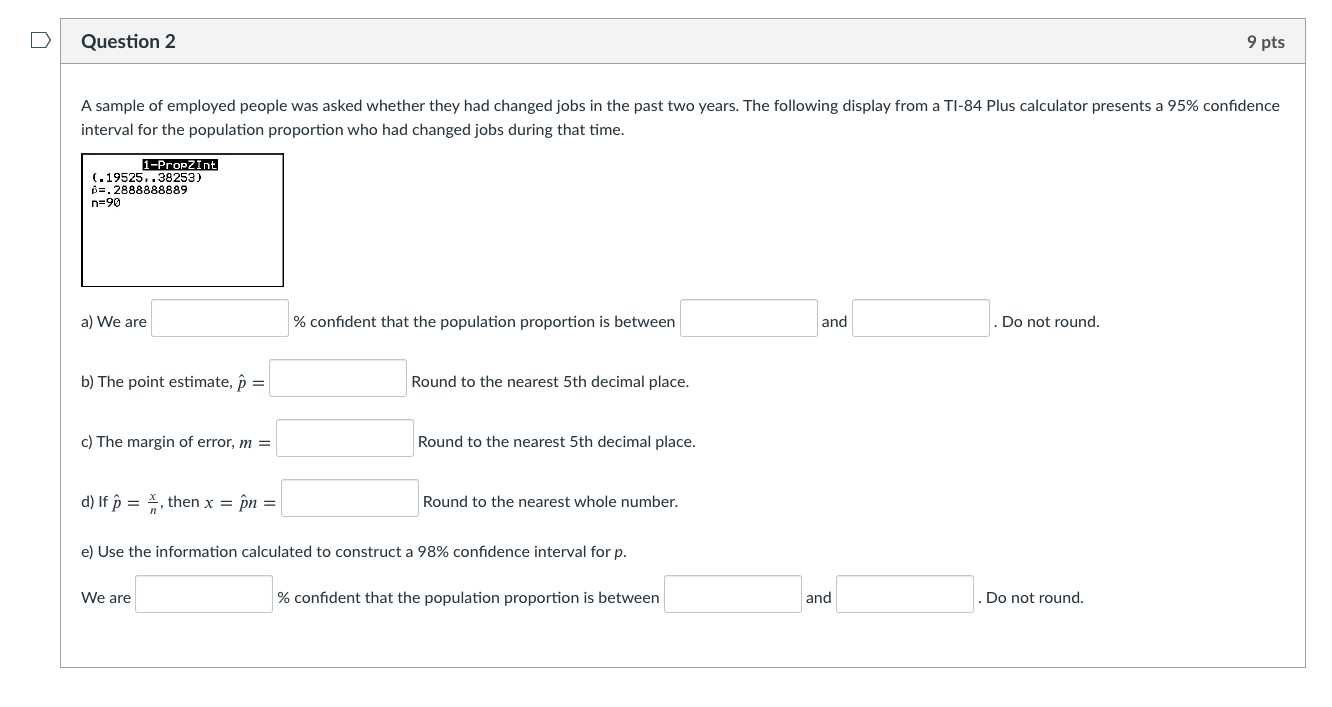
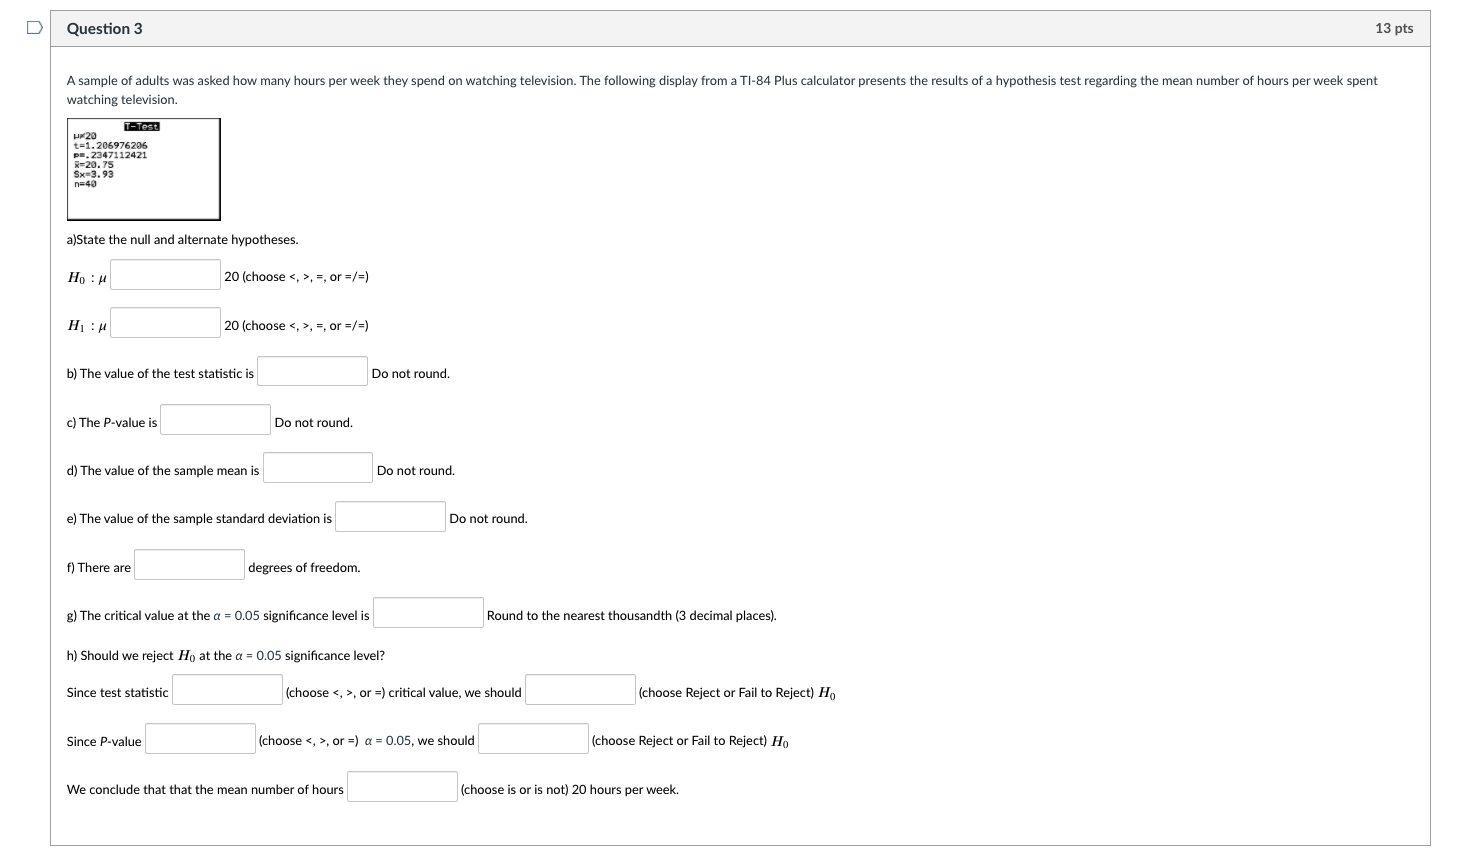
Question 1 3 pts Decide which calculator function to use for the hypotheses test in each situation... ' [Select] "'The mean annual tuition and fees for a sample of 14 private colleges in California was $37,900 with a standard deviation of $7,200. A dotplot shows that it is reasonable to assume that the population is approximately normal. Can you conclude that the mean tuition and fees for private institutions in California differs from $35,000? ' [Select] V' In a survey of 444 HIV-positive smokers, 170 reported that they had used a nicotine patch to try to quit smoking. Can you conclude that less than half of HIV-positive smokers have used a nicotine patch? Use the a = 0.05 level of signicance. ' [Select] V'A random sample of 60 second graders in a certain school district are given a standardized mathematics skills test. The sample mean score is i = 52. Assume the standard deviation of test scores is o = 15. The nationwide average score on this test is 50. The school superintendent wants to know whether the second graders in her school district have greater math skills than the nationwide average. D Question 2 9 pts A sample of employed people was asked whether they had changed jobs in the past two years. The following display from a TI-84 Plus calculator presents a 95% confidence interval for the population proportion who had changed jobs during that time. 1-PropZInt (. 19525, . 38253) 6=. 2888888889 n=90 a) We are % confident that the population proportion is between and Do not round. b) The point estimate, p = Round to the nearest 5th decimal place. c) The margin of error, m = Round to the nearest 5th decimal place. d) If p = *, then x = pn = Round to the nearest whole number. e) Use the information calculated to construct a 98% confidence interval for p. We are % confident that the population proportion is between and Do not round.D Question 3 13 pts A sample of adults was asked how many hours per week they spend on watching television. The following display from a TI-84 Plus calculator presents the results of a hypothesis test regarding the mean number of hours per week spent watching television. T-Test HP20 t=1.206976206 pu. 2347112421 R=20.75 Sx-3.93 1=40 a)State the null and alternate hypotheses. Ho : H 20 (choose , =, or =/=) HI : H 20 (choose , =, or =/=) b) The value of the test statistic is Do not round. c) The P-value is Do not round. d) The value of the sample mean is Do not round. e) The value of the sample standard deviation is Do not round. f) There are degrees of freedom. g) The critical value at the a = 0.05 significance level is Round to the nearest thousandth (3 decimal places). h) Should we reject Ho at the a = 0.05 significance level? Since test statistic (choose , or =) critical value, we should (choose Reject or Fail to Reject) Ho Since P-value (choose , or =) a = 0.05, we should (choose Reject or Fail to Reject) Ho We conclude that that the mean number of hours (choose is or is not) 20 hours per week


