

Question
Question 1: A local company located in Nizwa assembles engines for customized trekking sport utility vehicle SUV. During the year end 2019 financial review, the
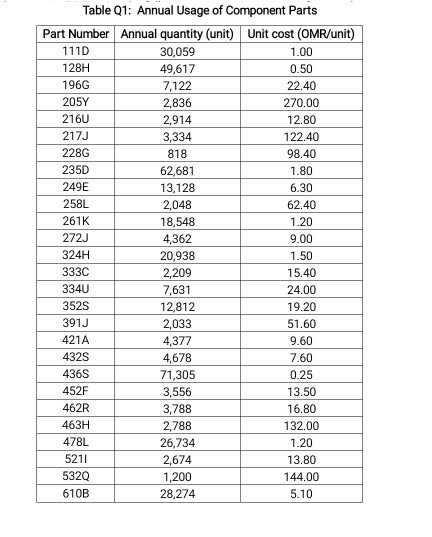
Question 1: A local company located in Nizwa assembles engines for customized trekking sport utility vehicle SUV. During the year end 2019 financial review, the company is concerned with its bloated inventory cost for the past five years. The profitability of the company has been declining year on year due to the effect of the increasing inventory costs. The newly hired manager who is a mechanical engineer is tasked to look into this matter and will provide a comprehensive proposal report to the company CEO to reduce the bloating inventory cost. The current consumption or usage of parts of the assembly department is shown in Table Q1. This data shows the typical annual usage or consumption of component parts for its engines. He found out that there is big mismanagement or neglect of the company inventories. Currently, the company is ordering parts from its suppliers locally and abroad once every three months. (i) Develop an ABC analysis for the company's inventories. Show completely the results in tabular form using excel. [6] (ii) Create a PARETO analysis for the ABC analysis using excel [4] (iii) Considering your 'class A' inventories, determine the economic order quantity EOQ using the following assumptions; zero safety stock for each class A inventories, stocking cost is 10% of the unit price, ordering cost for any class A inventories is 120 OMR per order. Determine the cost savings if EOQ is followed instead of the current ordering system of the company which is once every three months for 'class A' inventories [6]
this is the table which includes with question .
Table Q1: Annual Usage of Component Parts Part Number Annual quantity (unit) Unit cost (OMR/unit) 111D 30,059 1.00 128H 49,617 0.50 196G 7,122 22.40 205Y 2,836 270.00 2160 2,914 12.80 217J 3,334 122.40 228G 818 98.40 235D 62,681 1.80 249E 13,128 6.30 258L 2,048 62.40 261K 18,548 1.20 272J 4,362 9.00 324H 20,938 1.50 333C 2,209 15.40 3340 7,631 24.00 3525 12,812 19.20 391J 2,033 51.60 421A 4,377 9.60 432S 4,678 7.60 436S 71,305 0.25 452F 3,556 13.50 462R 3,788 16.80 463H 2,788 132.00 478L 26,734 1.20 5211 2,674 13.80 5320 1,200 144.00 610B 28,274 5.10 Table Q1: Annual Usage of Component Parts Part Number Annual quantity (unit) Unit cost (OMR/unit) 111D 30,059 1.00 128H 49,617 0.50 196G 7,122 22.40 205Y 2,836 270.00 2160 2,914 12.80 217J 3,334 122.40 228G 818 98.40 235D 62,681 1.80 249E 13,128 6.30 258L 2,048 62.40 261K 18,548 1.20 272J 4,362 9.00 324H 20,938 1.50 333C 2,209 15.40 3340 7,631 24.00 3525 12,812 19.20 391J 2,033 51.60 421A 4,377 9.60 432S 4,678 7.60 436S 71,305 0.25 452F 3,556 13.50 462R 3,788 16.80 463H 2,788 132.00 478L 26,734 1.20 5211 2,674 13.80 5320 1,200 144.00 610B 28,274 5.10Step by Step Solution
There are 3 Steps involved in it
Step: 1

Get Instant Access to Expert-Tailored Solutions
See step-by-step solutions with expert insights and AI powered tools for academic success
Step: 2

Step: 3
Ace Your Homework with AI
Get the answers you need in no time with our AI-driven, step-by-step assistance
Get Started
Sustainability Success In Business A Practical Guide To Managing Climate Risk In Your Organisation
Authors: Megyn Carpenter
1922375209, 978-1922375209