Answered step by step
Verified Expert Solution
Link Copied!

Question

1 Approved Answer

Question 1: A manager wants to investigate a bottling process by using a sample mean chart. He knows from his experience that the process standard
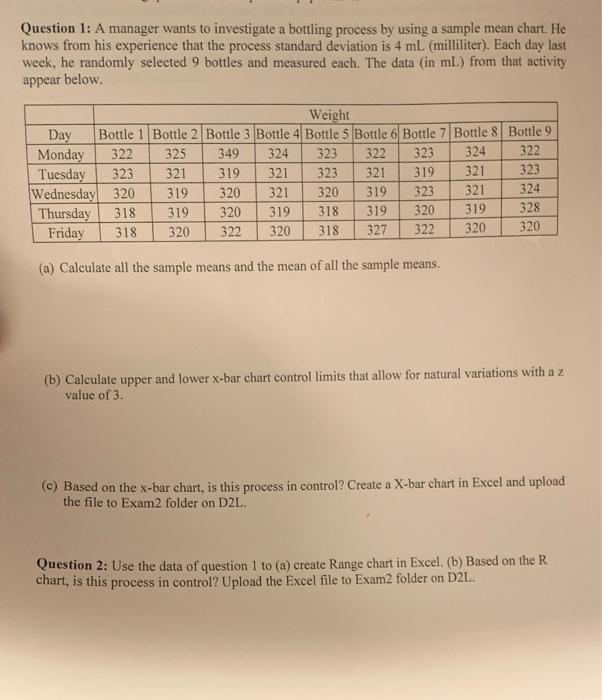
image text in transcribed
Question 1: A manager wants to investigate a bottling process by using a sample mean chart. He knows from his experience that the process standard deviation is 4 mL (milliliter). Each day last week, he randomly selected 9 bottles and measured each. The data (in mL) from that activity appear below. Weight Day Bottle 1 Bottle 2 Bottle 3 Bottle 4 Bottle 5 Bottle 6 Bottle 7 Bottle 8 Bottle 9 Monday 322 325 349 324 323 322 323 324 322 Tuesday 323 321 319 321 323 321 321 323 Wednesday 320 319 320 319 323 321 324 Thursday 318 319 320 319 318 319 320 319 328 Friday 318 320 322 320 318 327 322 320 320 319 320 321 (a) Calculate all the sample means and the mean of all the sample means. (b) Calculate upper and lower X-bar chart control limits that allow for natural variations with a z value of 3. Based on the x-bar chart, is this process in control? Create a X-bar chart in Excel and upload the file to Exam2 folder on D2L. Question 2: Use the data of question 1 to (a) create Range chart in Excel. (b) Based on the R chart, is this process in control? Upload the Excel file to Exam2 folder on D2L

Step by Step Solution

There are 3 Steps involved in it

Step: 1

blur-text-image

Get Instant Access to Expert-Tailored Solutions

See step-by-step solutions with expert insights and AI powered tools for academic success

Step: 2

blur-text-image

Step: 3

blur-text-image

Ace Your Homework with AI

Get the answers you need in no time with our AI-driven, step-by-step assistance

Get Started

Recommended Textbook for

Achieving Financial Stability In America

Authors: Misook Yu CFP

1st Edition

1732024510, 978-1732024519

More Books

Students also viewed these Finance questions