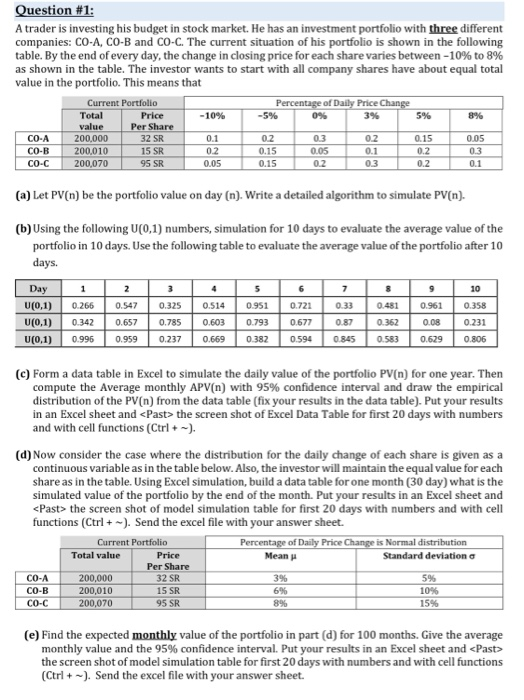
Question #1: A trader is investing his budget in stock market. He has an investment portfolio with three different companies: CO-A, CO-B and Co-C. The current situation of his portfolio is shown in the following table. By the end of every day, the change in closing price for each share varies between -10% to 8% as shown in the table. The investor wants to start with all company shares have about equal total value in the portfolio. This means that Percentage of Daily Price Change -5% 0% 3% -10% 5% 8% Current Portfolio Total Price value Per Share 200,000 32 SR 200.010 1 5 SR 200,070 95 SR CO-A CO-B co-C 03 005 (a) Let PV(n) be the portfolio value on day (n). Write a detailed algorithm to simulate PV(n). (b) Using the following U(0,1) numbers, simulation for 10 days to evaluate the average value of the portfolio in 10 days. Use the following table to evaluate the average value of the portfolio after 10 days. 1 0.266 2 0.547 3 4 5 6 0.3250.5140 9510.721 7 033 8 0481 9 0.961 1 0.358 Day U(0.1) U(0,1) U(0,1) 0.342 0.996 0.657 0.959 0.785 0.237 0.603 0.669 0.793 0.382 0.677 0.594 0.87 0.845 0.362 0.583 0.08 0.629 0.231 0.806 (c) Form a data table in Excel to simulate the daily value of the portfolio PV(n) for one year. Then compute the Average monthly APV(n) with 95% confidence interval and draw the empirical distribution of the PV(n) from the data table (fix your results in the data table). Put your results in an Excel sheet and
the screen shot of model simulation table for first 20 days with numbers and with cell functions (Ctrl+-). Send the excel file with your answer sheet. Question #1: A trader is investing his budget in stock market. He has an investment portfolio with three different companies: CO-A, CO-B and Co-C. The current situation of his portfolio is shown in the following table. By the end of every day, the change in closing price for each share varies between -10% to 8% as shown in the table. The investor wants to start with all company shares have about equal total value in the portfolio. This means that Percentage of Daily Price Change -5% 0% 3% -10% 5% 8% Current Portfolio Total Price value Per Share 200,000 32 SR 200.010 1 5 SR 200,070 95 SR CO-A CO-B co-C 03 005 (a) Let PV(n) be the portfolio value on day (n). Write a detailed algorithm to simulate PV(n). (b) Using the following U(0,1) numbers, simulation for 10 days to evaluate the average value of the portfolio in 10 days. Use the following table to evaluate the average value of the portfolio after 10 days. 1 0.266 2 0.547 3 4 5 6 0.3250.5140 9510.721 7 033 8 0481 9 0.961 1 0.358 Day U(0.1) U(0,1) U(0,1) 0.342 0.996 0.657 0.959 0.785 0.237 0.603 0.669 0.793 0.382 0.677 0.594 0.87 0.845 0.362 0.583 0.08 0.629 0.231 0.806 (c) Form a data table in Excel to simulate the daily value of the portfolio PV(n) for one year. Then compute the Average monthly APV(n) with 95% confidence interval and draw the empirical distribution of the PV(n) from the data table (fix your results in the data table). Put your results in an Excel sheet and the screen shot of model simulation table for first 20 days with numbers and with cell functions (Ctrl+-). Send the excel file with your answer sheet


