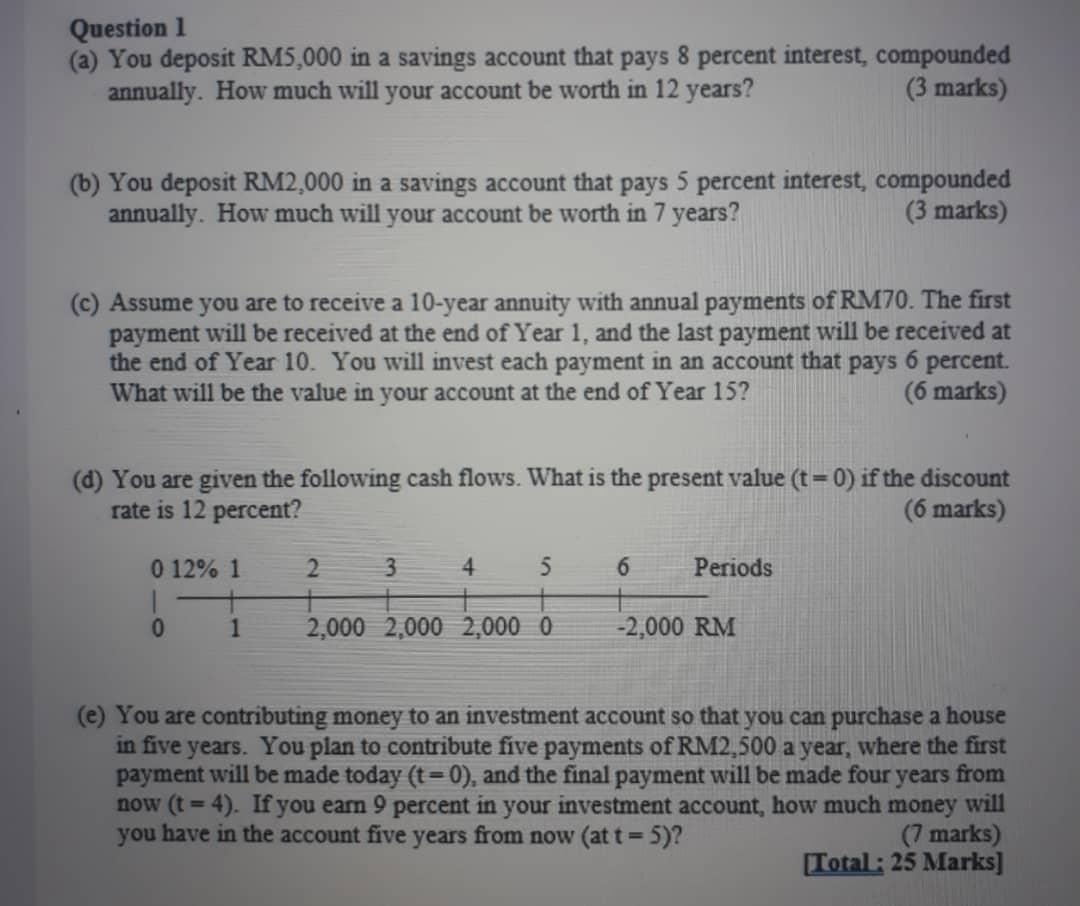
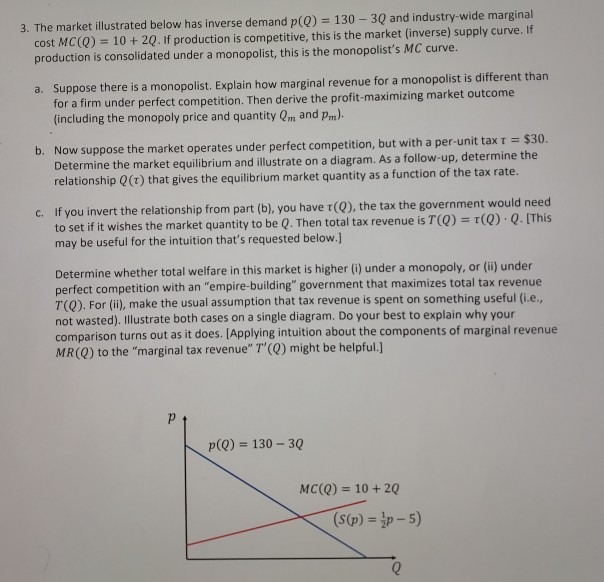
Question 1 (a) You deposit RM5,000 in a savings account that pays 8 percent interest, compounded annually. How much will your account be worth in 12 years? (3 marks) (b) You deposit RM2,000 in a savings account that pays 5 percent interest, compounded annually. How much will your account be worth in 7 years? (3 marks) (c) Assume you are to receive a 10-year annuity with annual payments of RM70. The first payment will be received at the end of Year 1, and the last payment will be received at the end of Year 10. You will invest each payment in an account that pays 6 percent. What will be the value in your account at the end of Year 15? (6 marks) (d) You are given the following cash flows. What is the present value (t = 0) if the discount rate is 12 percent? (6 marks) 0 12% 1 2 4 5 6 Periods O 2,000 2,000 2,000 0 -2,000 RM (e) You are contributing money to an investment account so that you can purchase a house in five years. You plan to contribute five payments of RM2,500 a year, where the first payment will be made today (t = 0), and the final payment will be made four years from now (t = 4). If you earn 9 percent in your investment account, how much money will you have in the account five years from now (at t = 5)? (7 marks) [Total : 25 Marks]3. The market illustrated below has inverse demand p(Q) = 130 - 30 and industry-wide marginal cost MC(Q) = 10 + 2Q. If production is competitive, this is the market (inverse) supply curve. If production is consolidated under a monopolist, this is the monopolist's MC curve. a. Suppose there is a monopolist. Explain how marginal revenue for a monopolist is different than for a firm under perfect competition. Then derive the profit-maximizing market outcome (including the monopoly price and quantity Qm and Pm). b. Now suppose the market operates under perfect competition, but with a per-unit tax T = $30. Determine the market equilibrium and illustrate on a diagram. As a follow-up, determine the relationship Q(r) that gives the equilibrium market quantity as a function of the tax rate. C. If you invert the relationship from part (b), you have r((), the tax the government would need to set if it wishes the market quantity to be Q. Then total tax revenue is T(Q) = r(Q) . Q. [This may be useful for the intuition that's requested below. ] Determine whether total welfare in this market is higher (i) under a monopoly, or (ii) under perfect competition with an "empire-building" government that maximizes total tax revenue T(Q). For (ii), make the usual assumption that tax revenue is spent on something useful (i.e., not wasted). Illustrate both cases on a single diagram. Do your best to explain why your comparison turns out as it does. [Applying intuition about the components of marginal revenue MR(Q) to the "marginal tax revenue" "(Q) might be helpful.] P p(Q) = 130 - 3Q MC(Q) = 10+2Q (s(p) = 4p-5)Suppose market demand for food is: lU Or : P 1:. {3 points} What is the elasticity ofMand? (Hint: Recall the elasticity of demand is 6P Q 13. {to points} Draw a perfect competition diagram for a market with the cost function and demand function given in this section. Assume it is initially in long-um equilibrium {where the price is given by the long-nut supply]. Be sure to include one panel for the rm and another for the market. Label all curves. Suppose decreased income changes the demand curve to: 2E p 14. {9 points) Illustrate how the market adapts to this change using your diagram from question 13. Include the following labels: a. The initial price, individual quantity, and market quantity should be labeled p", q\1. A firm can manufacture a product according to the production function (LO], LO2, LO5, LO6) Q = F(K, L) = K3/4 1 1/4 a. Calculate the average product of labor, APL, when the level of capital is fixed at 81 units and the firm uses 16 units of labor. How does the average product of labor change when the firm uses 256 units of labor? b. Find an expression for the marginal product of labor, MPz, when the amount of capi- tal is fixed at 81 units. Then, illustrate that the marginal product of labor depends on the amount of labor hired by calculating the marginal product of labor for 16 and 81 units of labor. c. Suppose capital is fixed at 81 units. If the firm can sell its output at a price of $200 per unit of output and can hire labor at $50 per unit of labor, how many units of labor should the firm hire in order to maximize profits? 2. A firm's product sells for $4 per unit in a highly competitive market. The firm pro- duces output using capital (which it rents at $25 per hour) and labor (which is paid a wage of $30 per hour under a contract for 20 hours of labor services). Complete the following table and use that information to answer these questions. (LO], LO2, LO5, LO6) a. Identify the fixed and variable inputs. b. What are the firm's fixed costs? c. What is the variable cost of producing 475 units of output? d. How many units of the variable input should be used to maximize profits? e. What are the maximum profits this firm can earn? f. Over what range of the variable input usage do increasing marginal returns exist? g. Over what range of the variable input usage do decreasing marginal returns exist? h. Over what range of input usage do negative marginal returns exist?1- The data collected for USA over the period of 1950-2010. The following equation is estimated log(Dt)=-2.88+1.06log(Y.) (0.12) (0.293) where D. is defense expenditure and Y is GDP. Standard errors are in parenthesis. Find 95% confidence interval for parameters and interpret the parameter estimates. 2-We aim to fit following model EARNINGS = B, + B,SM + BSF + B,Math + u where hourly EARNINGS is regressed on a constant, Schooling of Mother (SM), Schooling of Father (SF) and Mathematical Capability (Math). Hourly earnings are measured in dollar, SM and SF are measured in schooling year and Math is measured by exam results. Regression analysis produces following output Dependent Variable: EARNINGS Method: Least Squares Sample: 540 Included observations: 540 Variable Coefficient Std. Error t-Statistic Prob. C 14.65851 3.589279 -4.083972 0.0001 SF 0.668173 0.220817 3.025912 0.0026 SM 0.277970 0.290546 0.956715 0.3391 Math 0.458015 0.066418 6.895906 0.0000 R-squared 0.166245 Mean dependent var 19.71924 Adjusted R-squared 0.161579 S.D. dependent var 14.60151 a-Interpret the parameter estimates (considering the test statistics). b- Comment on the goodness of fit of the model. C- A researcher claims that educated man/women prefer to get married to educated women/men. Suppose this argument is empirically verified for those individuals. Reassess the estimation results in the light of this evidence. d- It is claimed that the total effects of SM and SF on earnings is 1. Explain how you can this claim. Give all the details. d- A researcher calculates parent education as SP=SM+SF. Explain what would happen if the following model is estimated. EARNINGS = B, + B,SM + B,SF + B,Math + +BSP+u (2)