Answered step by step
Verified Expert Solution
Question
1 Approved Answer
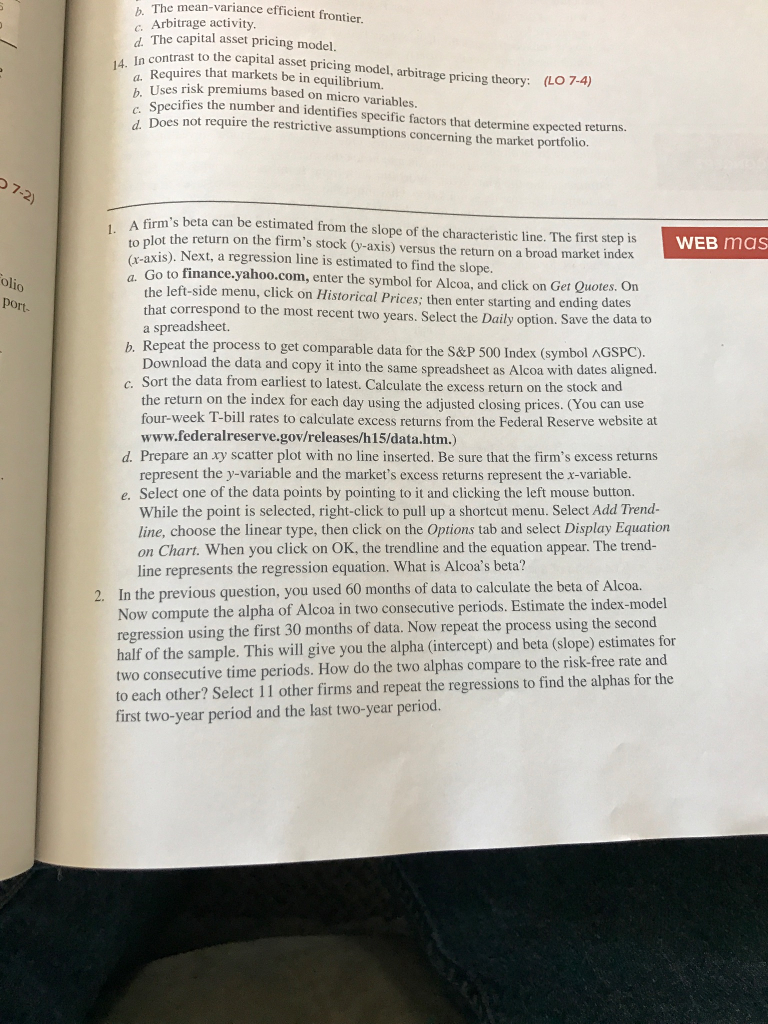
Question 1 and 2. Instead of using data for Alcoa, I need to use data for Citigroup Inc. I can pull the data and send

Question 1 and 2. Instead of using data for Alcoa, I need to use data for Citigroup Inc. I can pull the data and send to xcel. cant get the data to merge and xcel only posts 30 days on the spreadsheet. What am I doing wrong?
mean-variance efficient frontier Arbitrage activity. d. The capital asset pricing model 14. In to the capital asset pricing model, arbitrage pricing theory: (LO 7-4) Requires that markets be in equilibrium. s premiums based on micro variable Specifies d not the number and identifies factors determine expe require the restrictive assumptions concerning the market portfolio cted returns A firm's beta can be estimated from the slope of the characteristic ne. The first step is o plot the return on Go to Next, line abroad marketindex the finance.yahoo.com, is estimated the slope. click on Get Quotes. On left-side menu, enter symbol for Alcoa, and that correspond click on Historical Prices; then enter starting and ending dates a spreadsheet. to the most recent two years. Select the Daily option. Save the data to WEB mas b. Repeat the process to get comparable data for the S&P 500 Index (symbol Download the data and copy it into the same as dates aligned Sort the data from earliest to latest. Calculate the excess eturn on the stock and the return on the index for each day using the adjusted closing prices. (You can use four-week T-bill rates to calculate excess returns from the Federal Reserve website at www.federalreserve.gov/releases/h15/data.htm.) d. Prepare an xy scatter plot with no line inserted. Be sure at the firm's excess returns represent the y variable and the market's excess returns represent the x variable Select one of the data points by pointing to it and clicking the left mouse button. While the point is selected, right-click to pull up a shortcut menu. Select Add Trend line, choose the linear type, then click on the Options tab and select Display Equation on Chart. When you click on OK, the trendline and the equation appear. The trend- line represents the regression equation. What is Alcoa's beta? 2. In the previous question, you used 60 months of data to calculate the beta of Now compute the alpha of Alcoa in two consecutive periods. Estimate the index-model regression using the first 30 months of data. Now repeat the process using the second for half of the sample. This will give you the alpha (inter and beta (slope) estimates two consecutive time periods. How do the two alphas compare to the risk-free rate and to each other? Select 11 other firms and repeat the regressions to find the alphas for the first two-year period and the last two-year period
Step by Step Solution
There are 3 Steps involved in it
Step: 1

Get Instant Access to Expert-Tailored Solutions
See step-by-step solutions with expert insights and AI powered tools for academic success
Step: 2

Step: 3

Ace Your Homework with AI
Get the answers you need in no time with our AI-driven, step-by-step assistance
Get Started


