Question 1 Answer saved Marked out of 2.00 V7 Flag question Quiz navigation Finish attempt A scatterplot with a line of best fit is shown
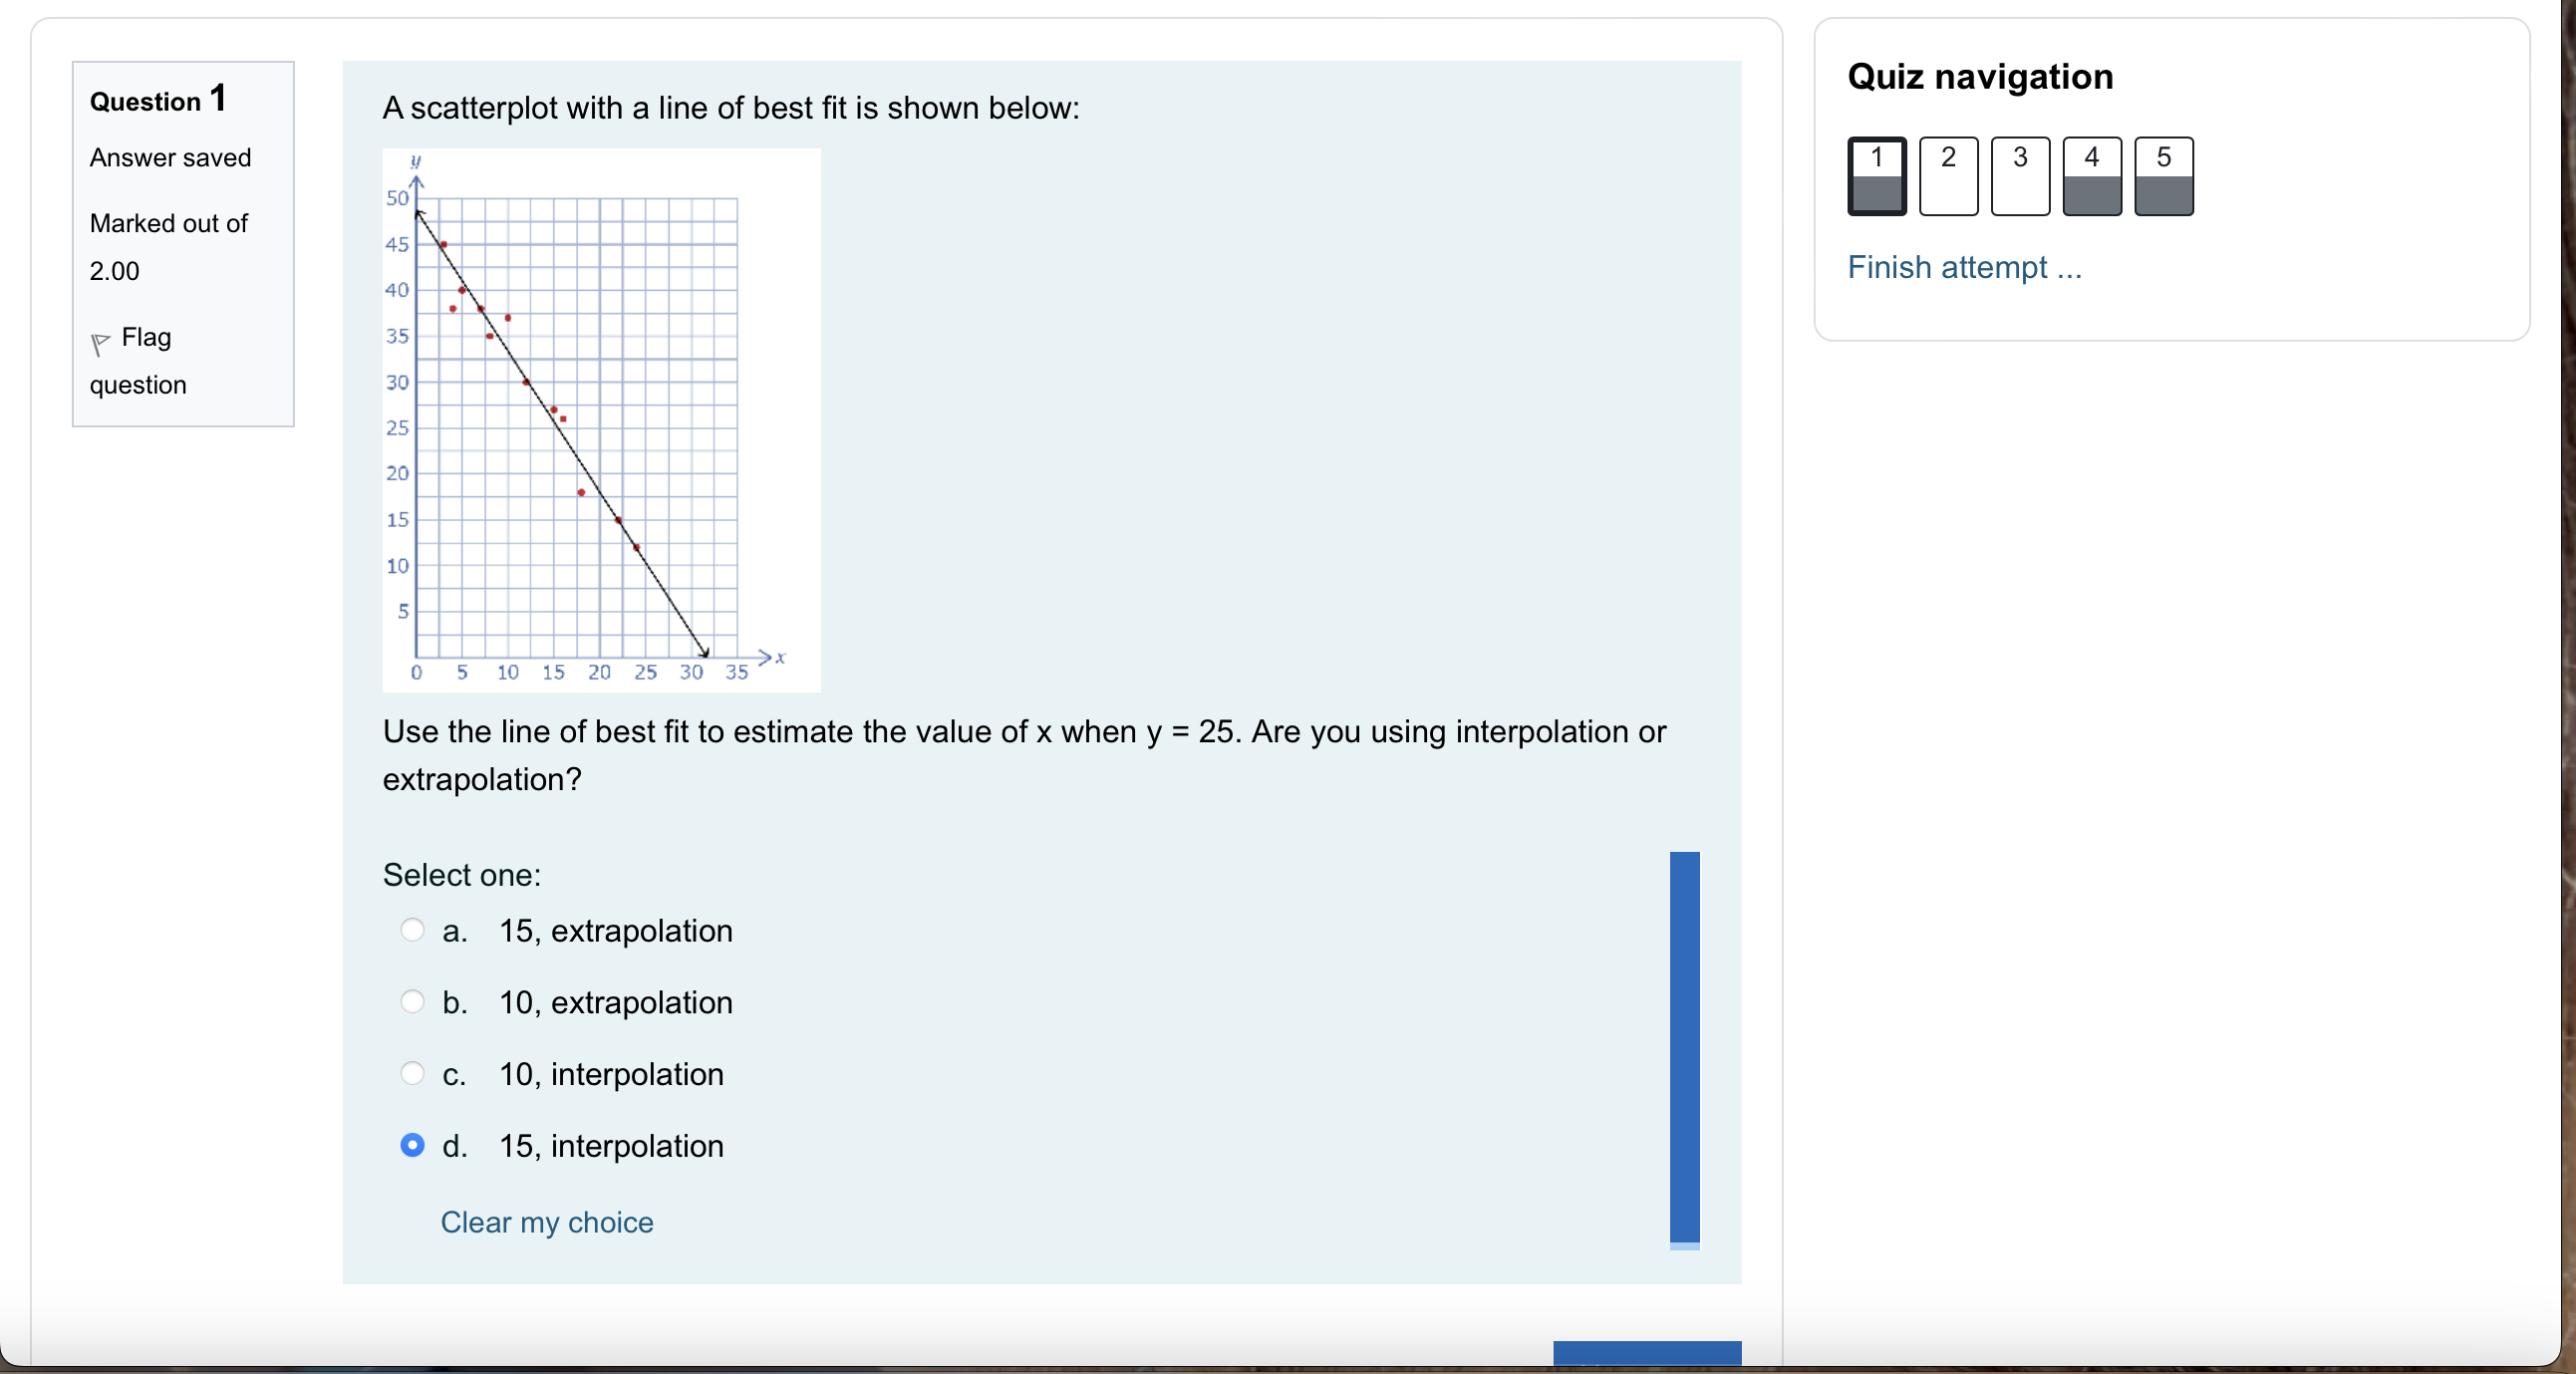
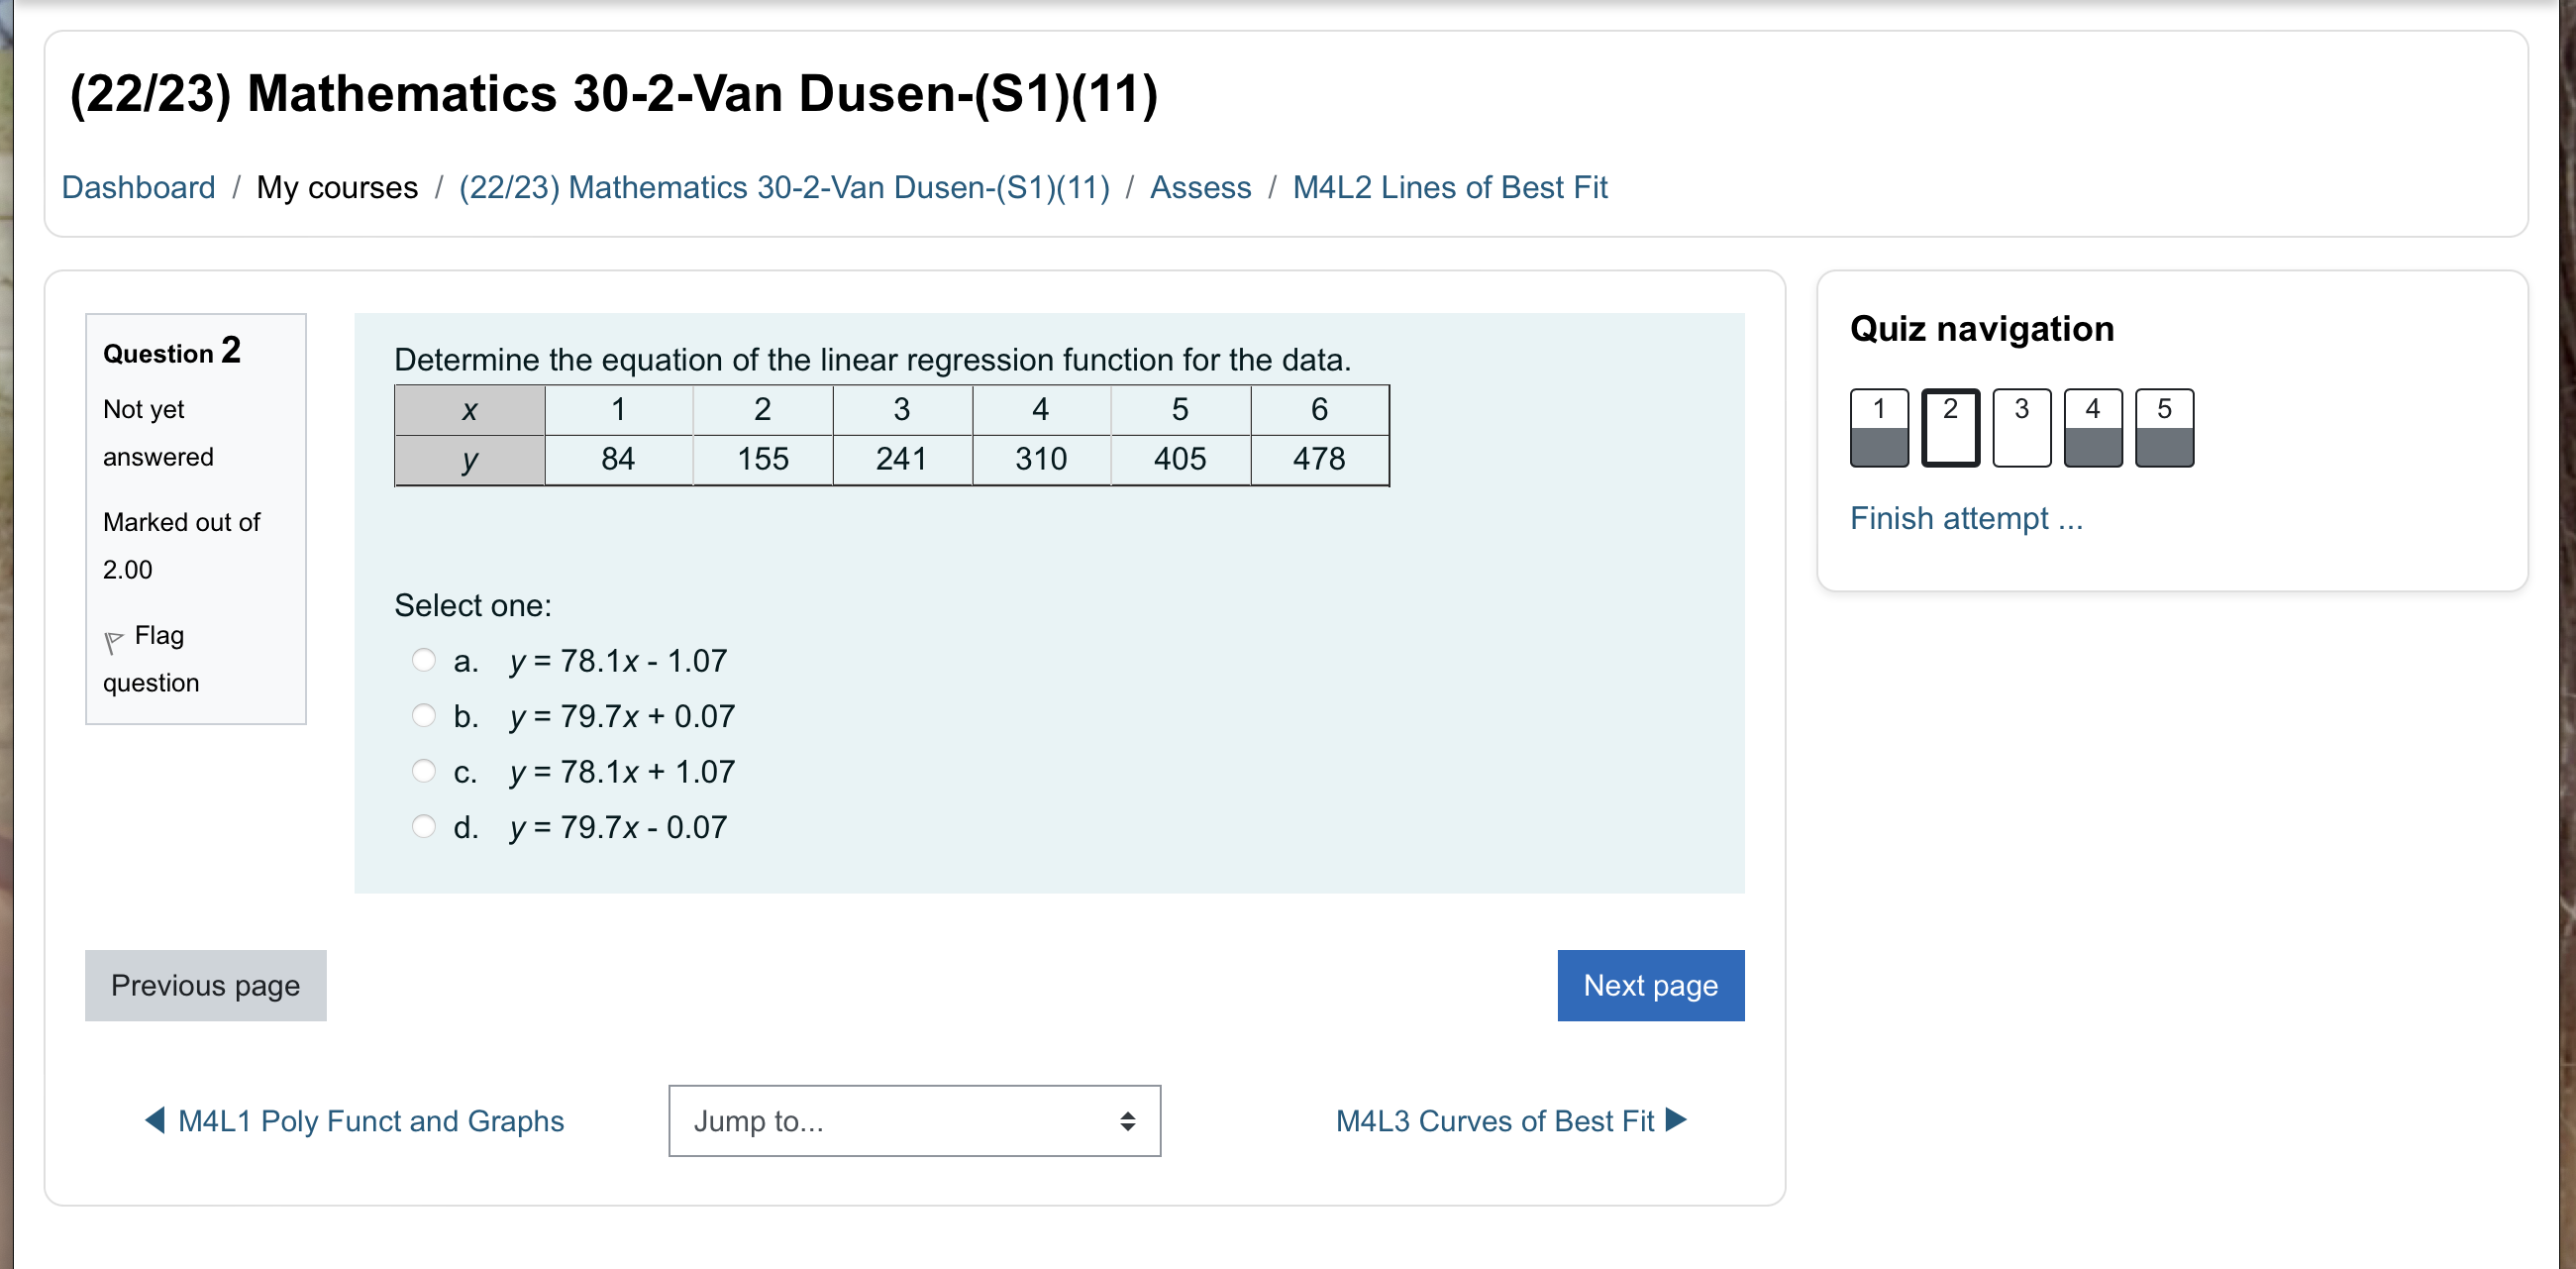
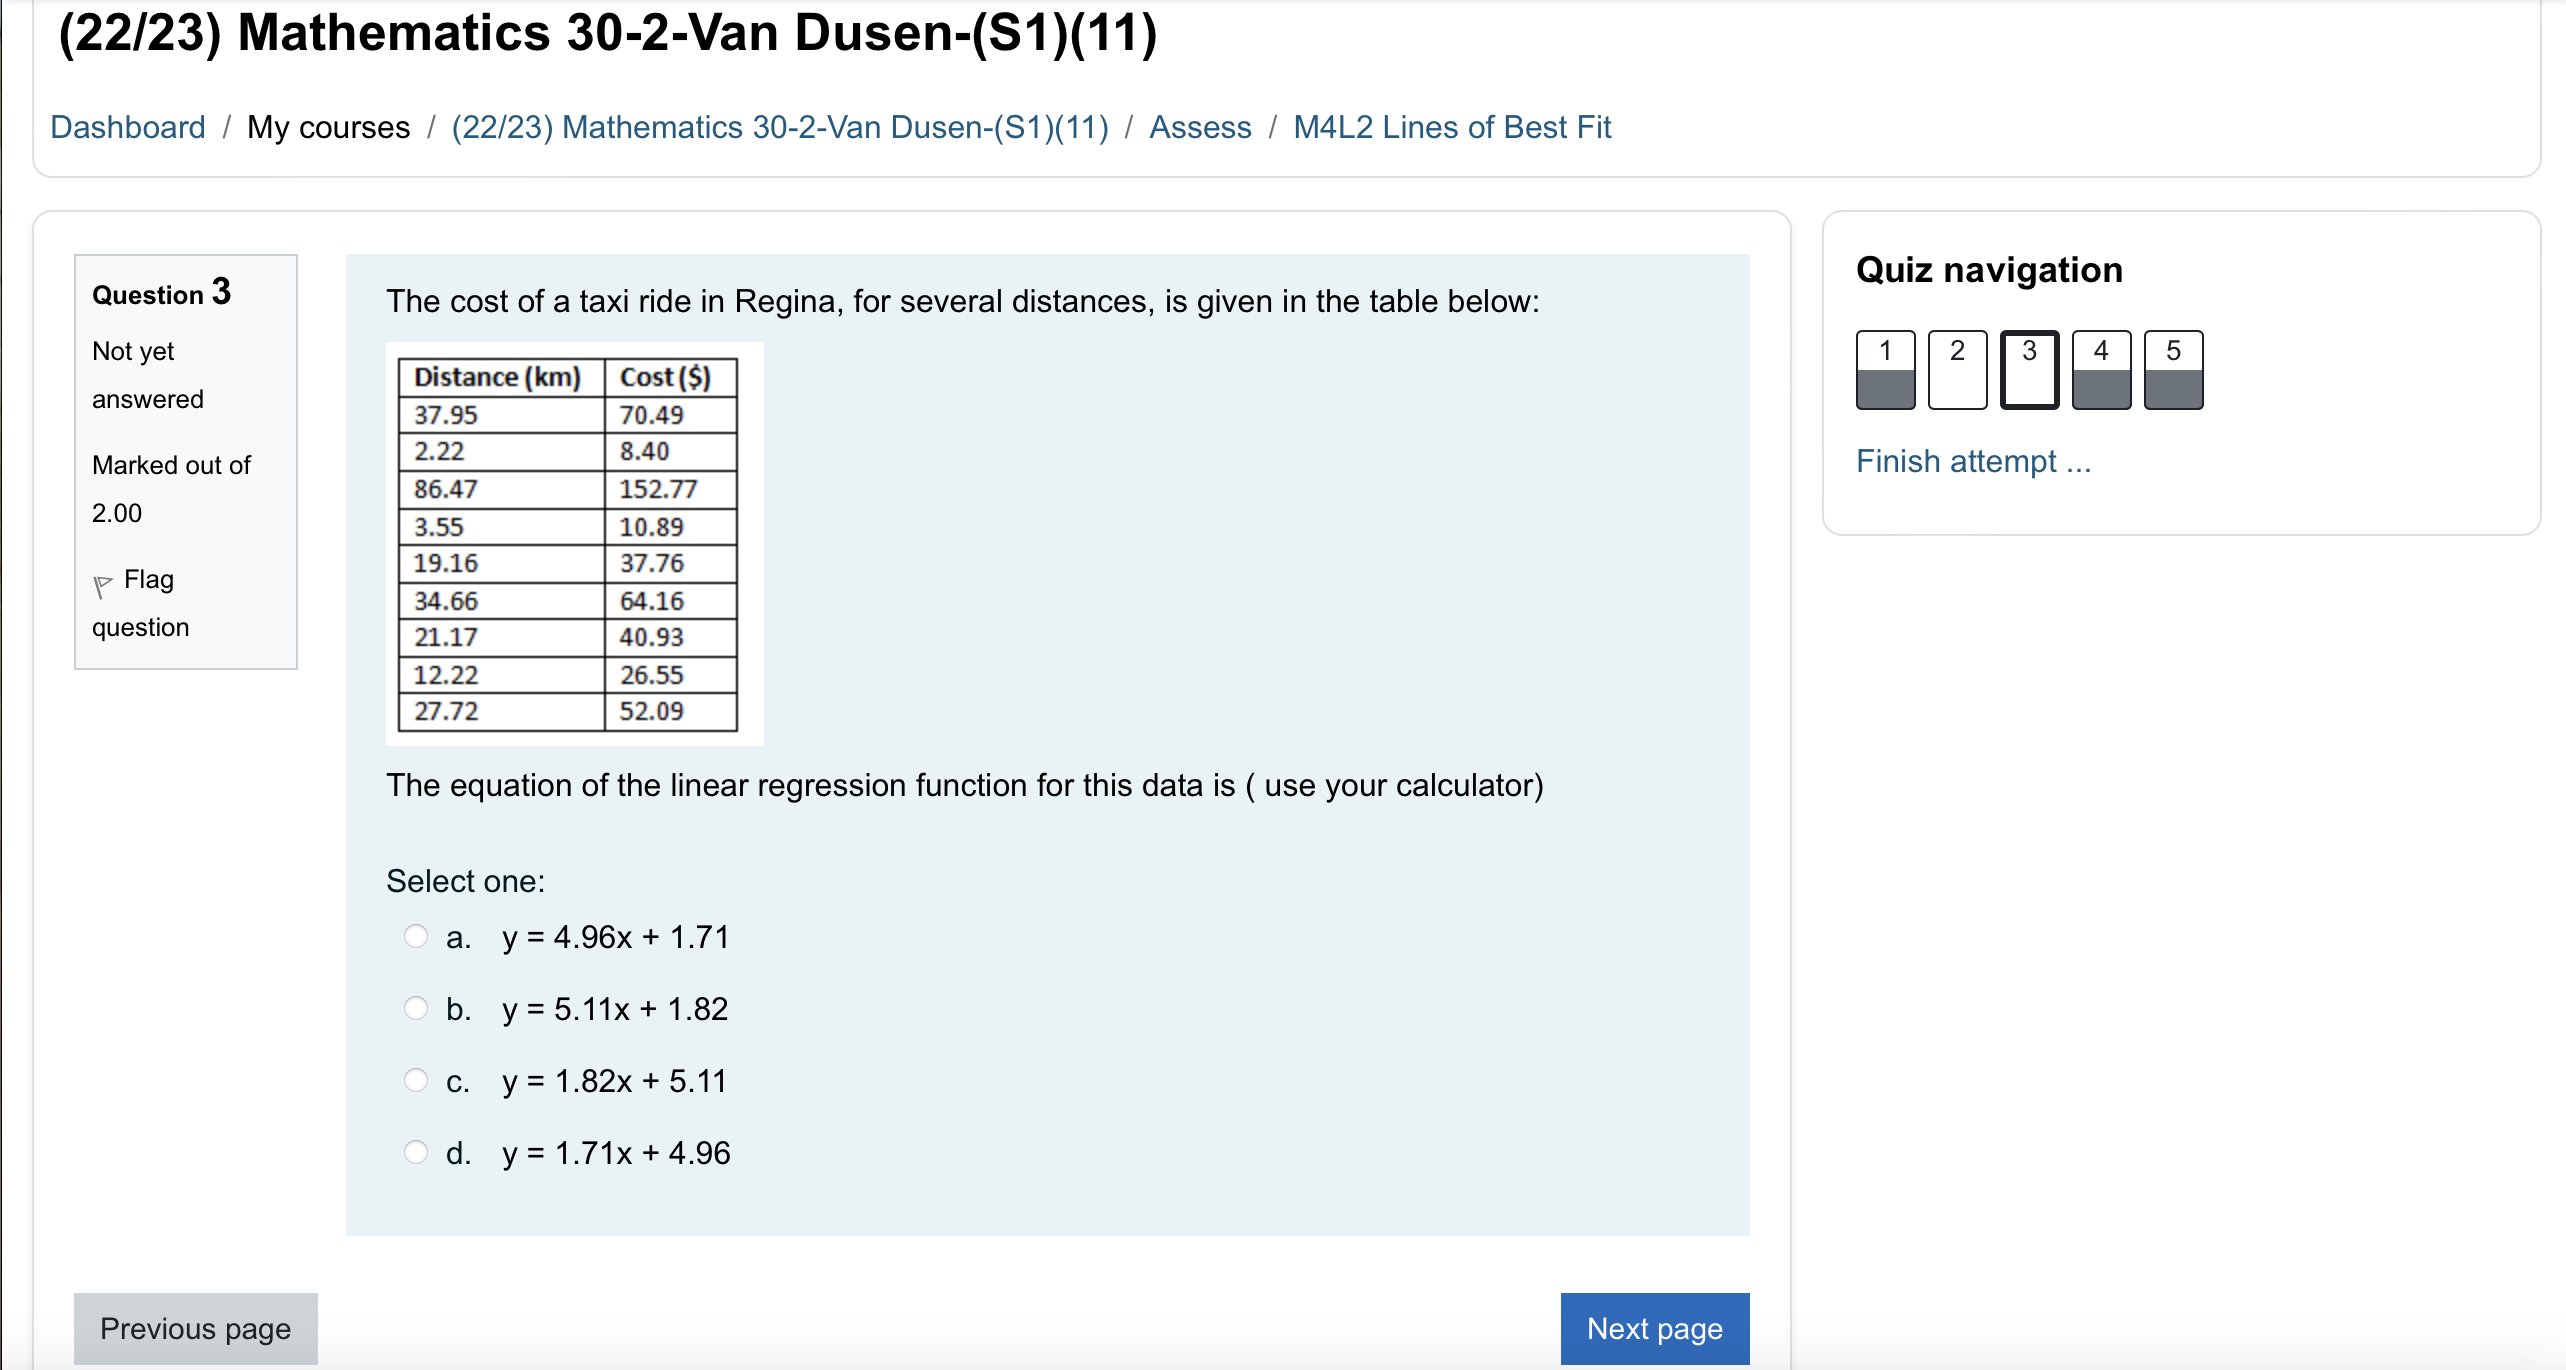
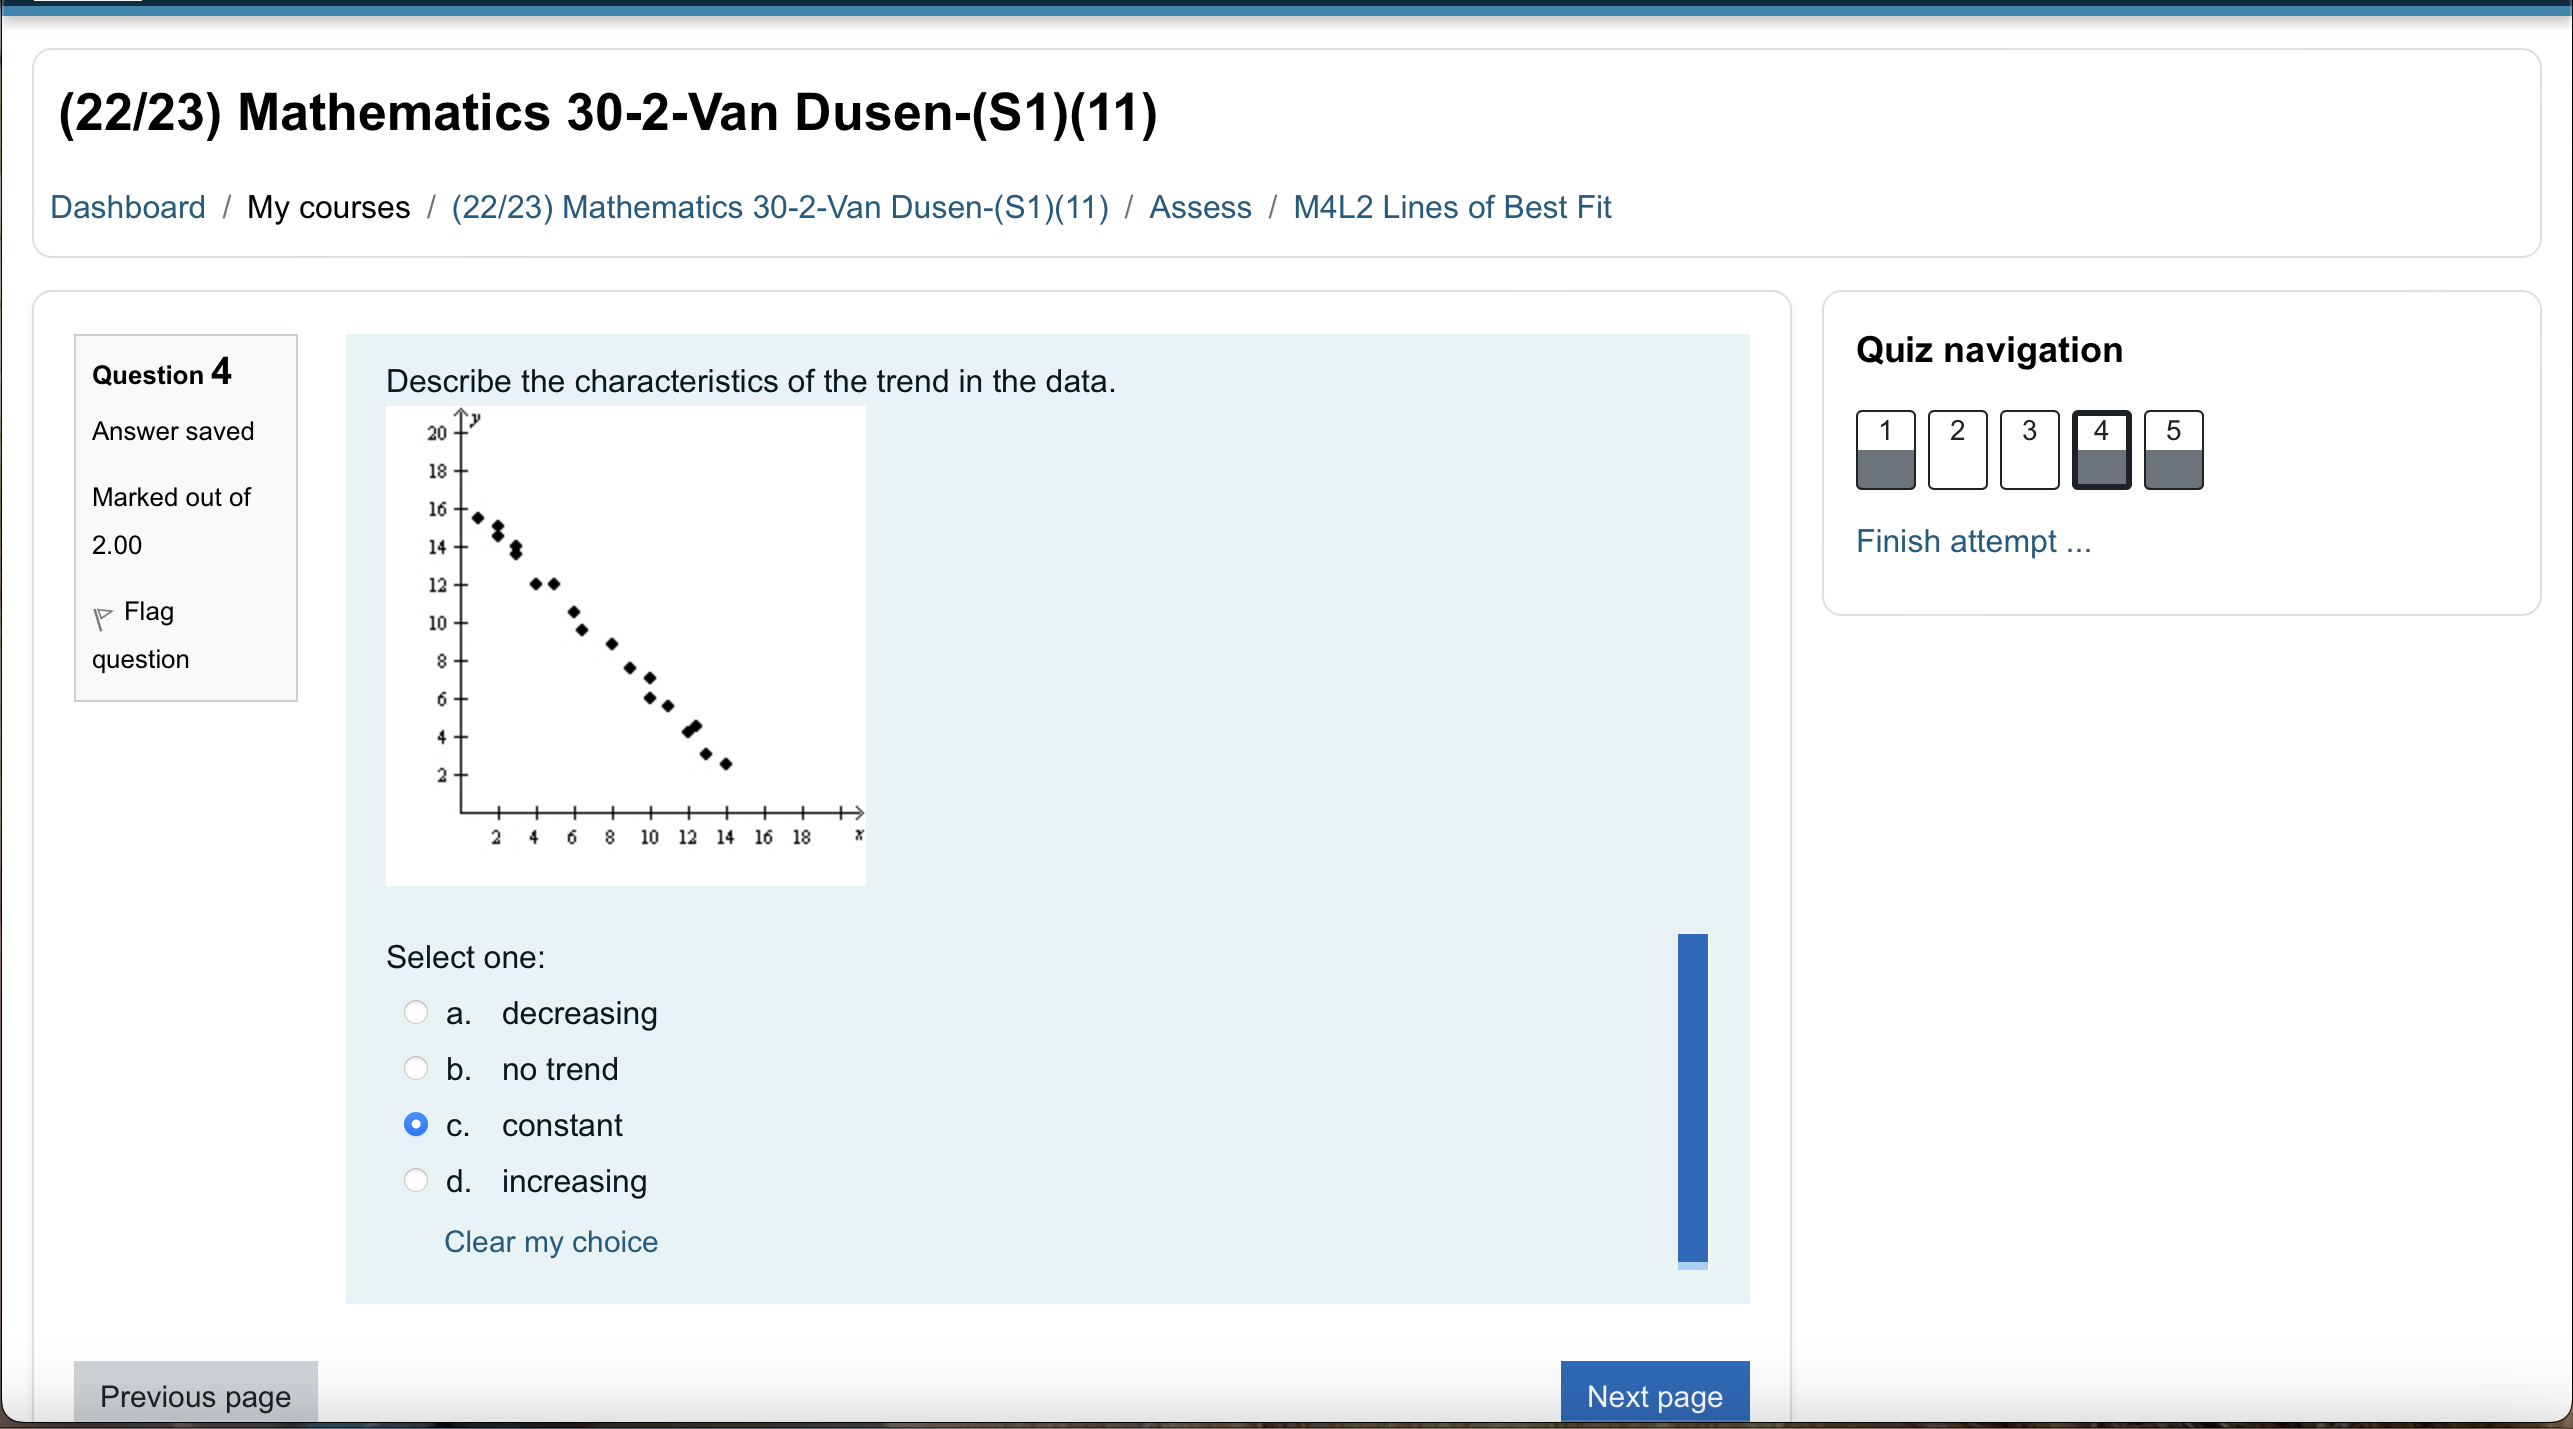
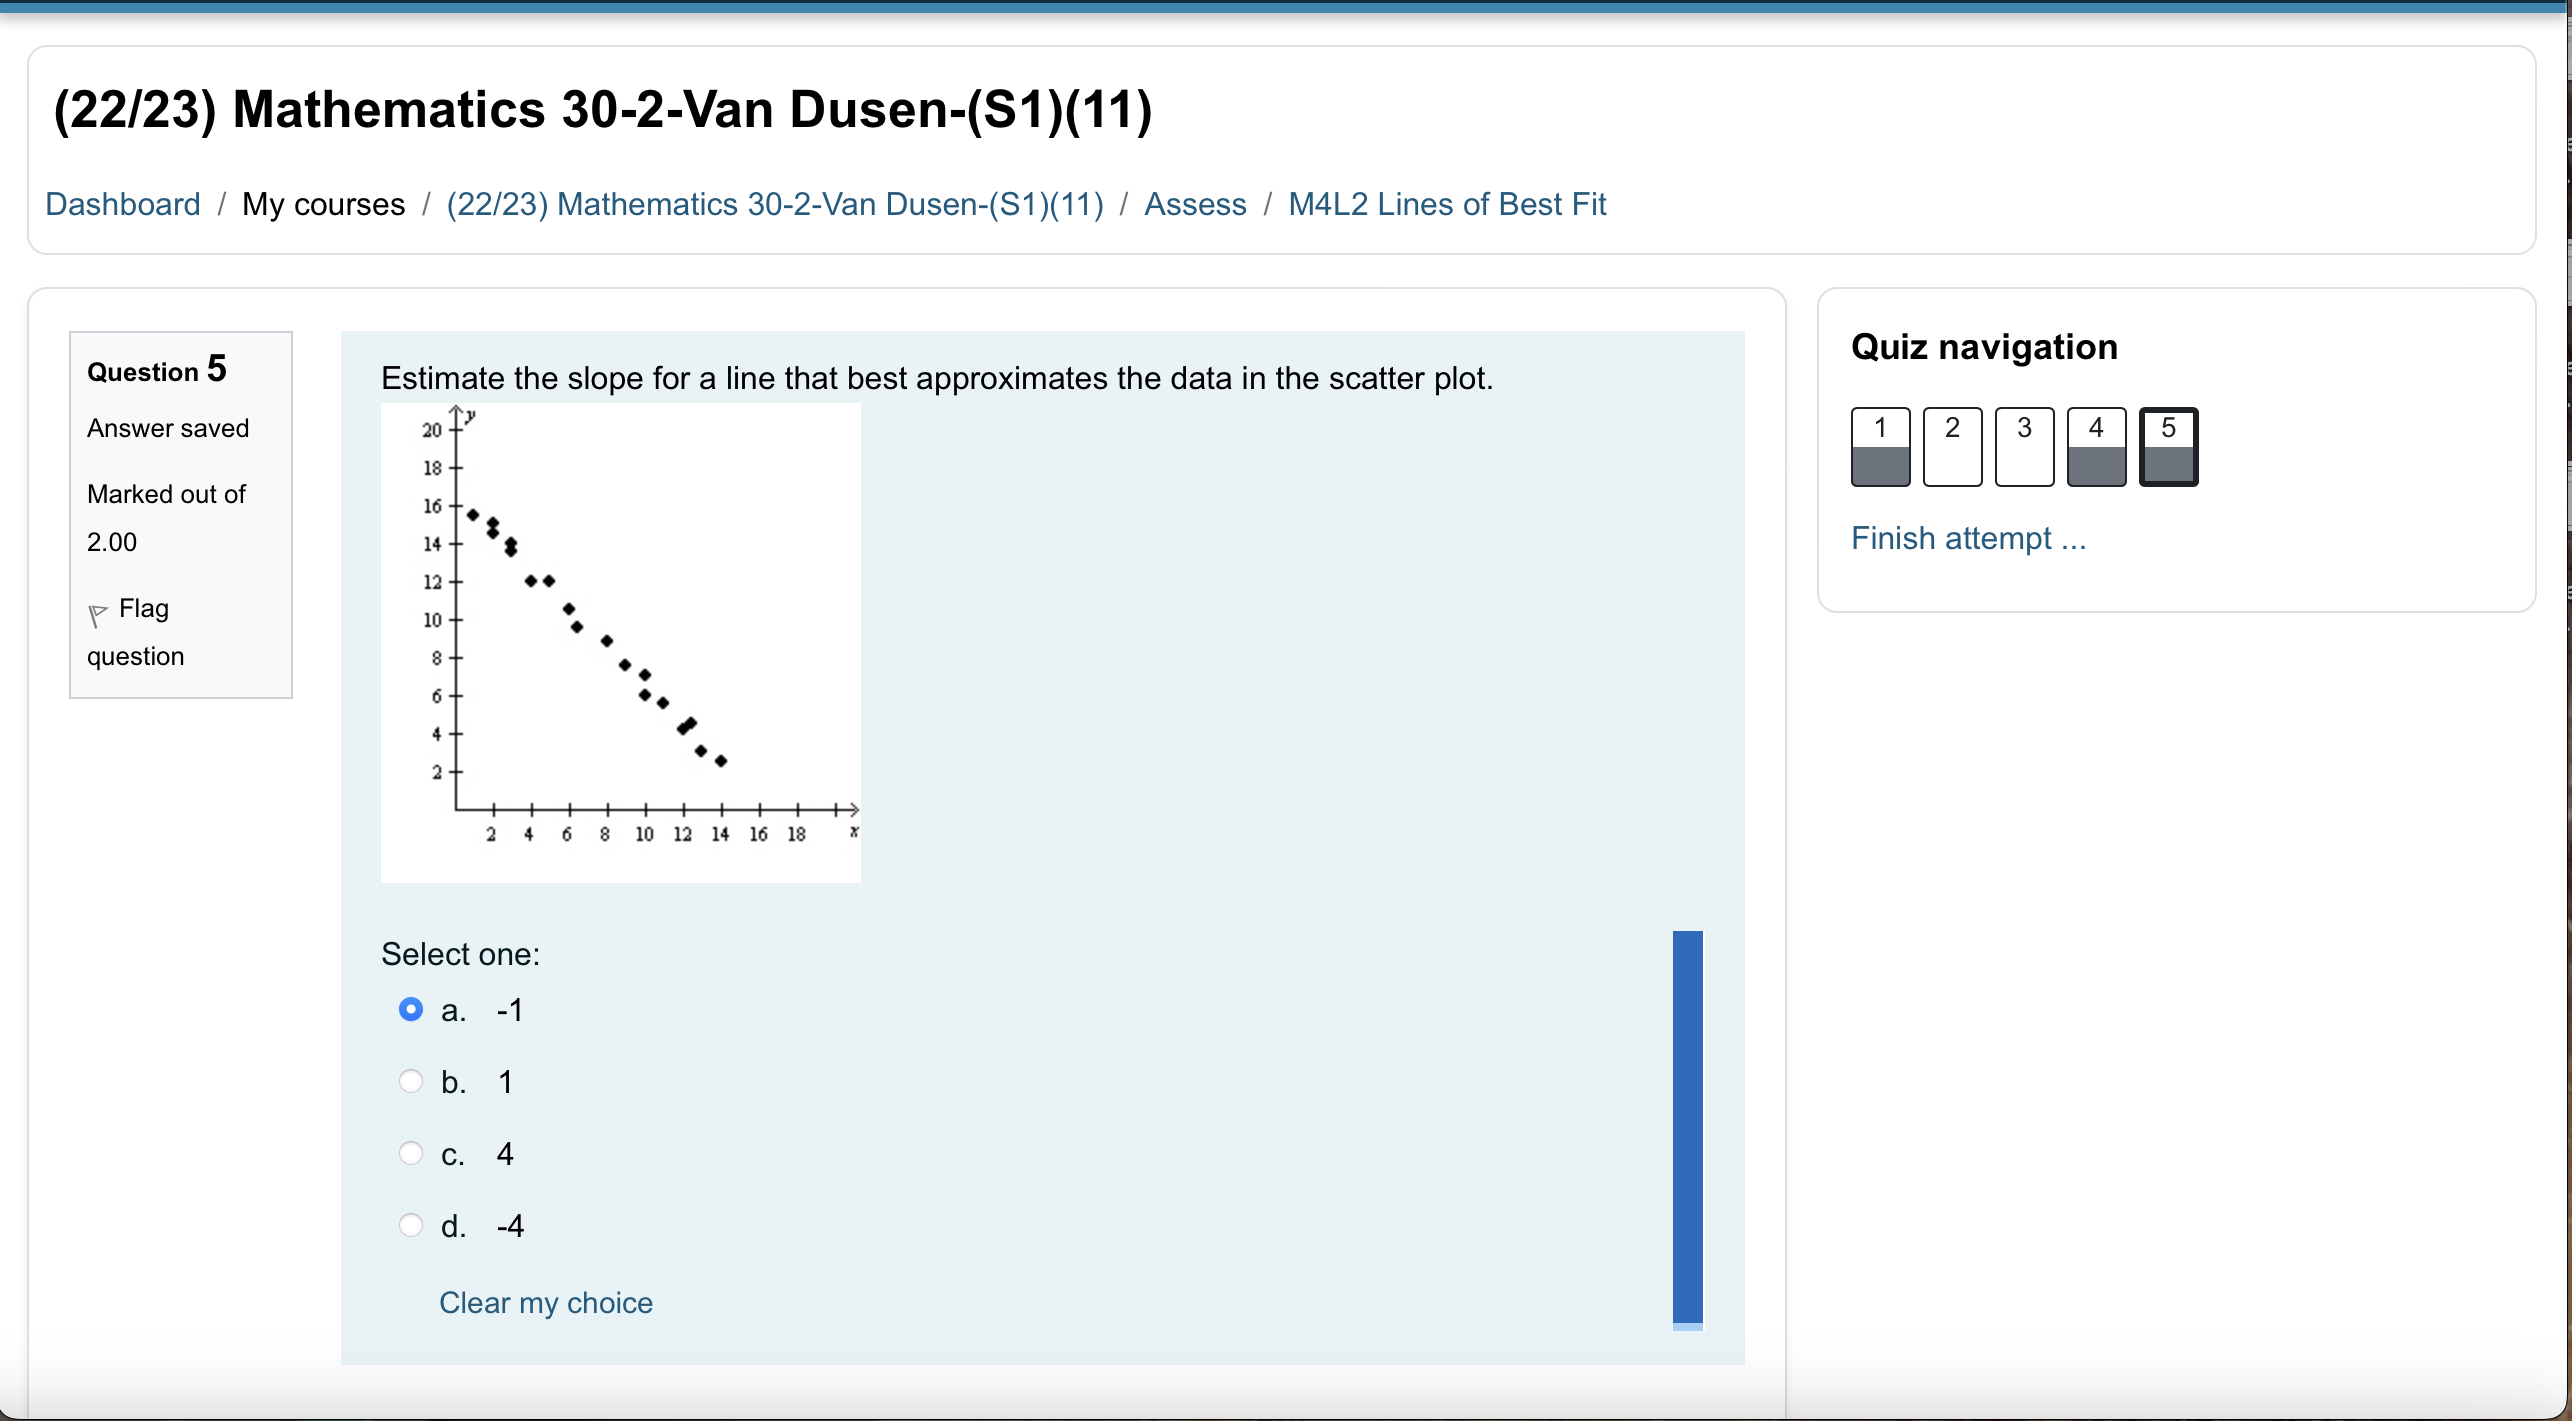
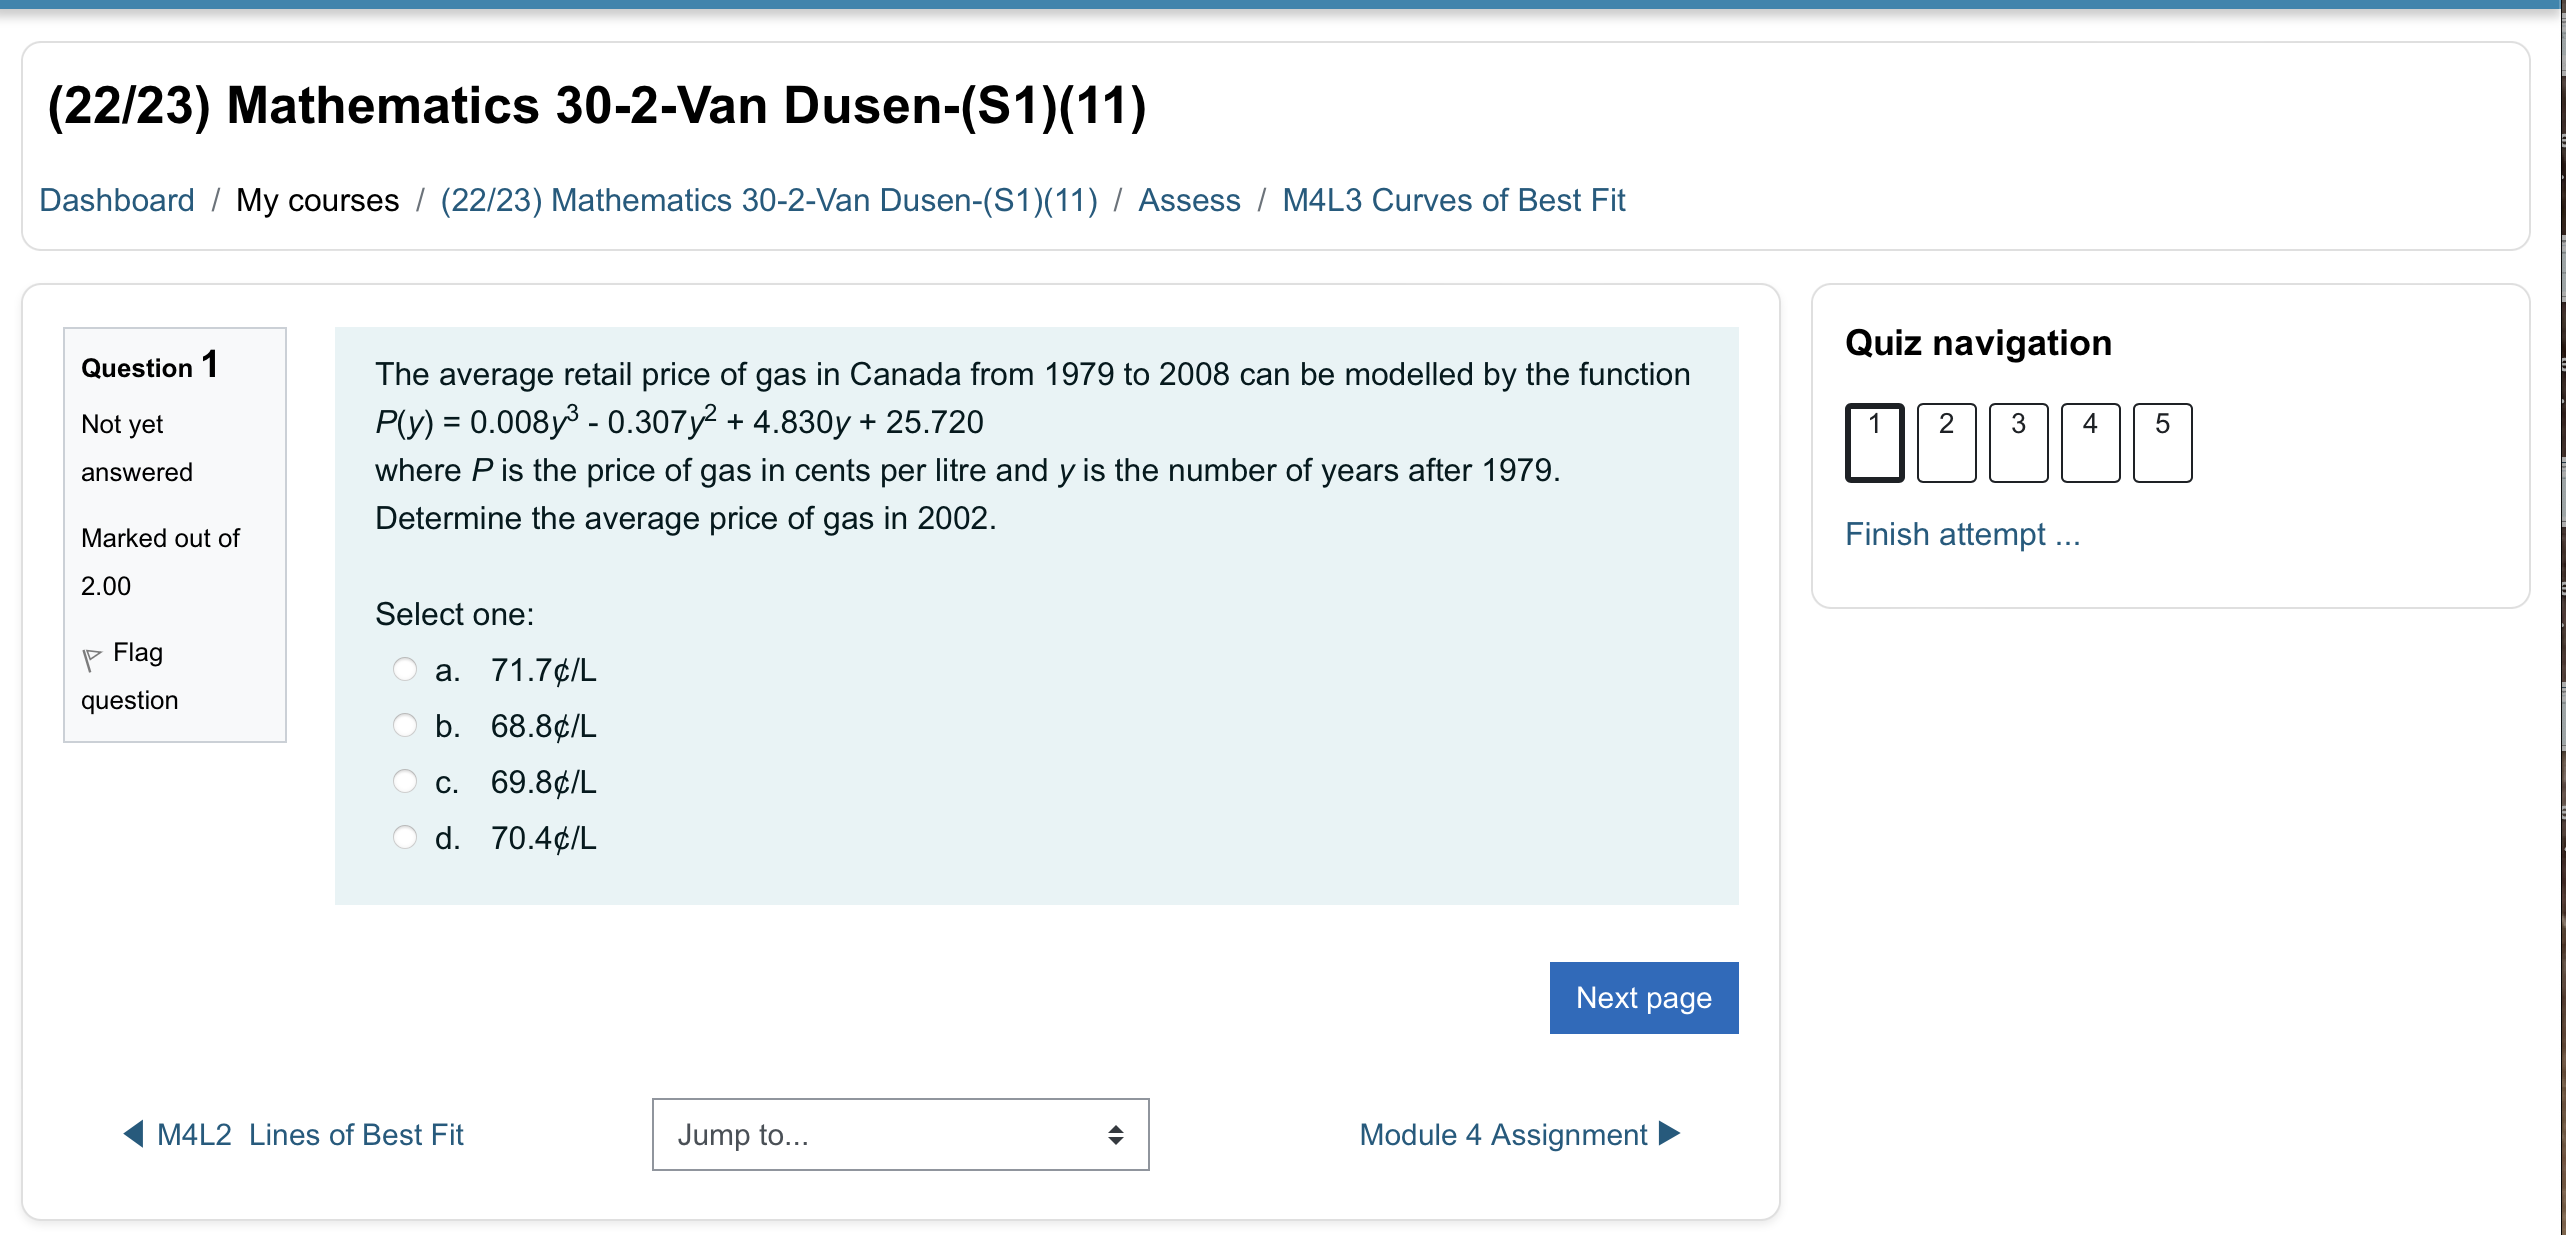
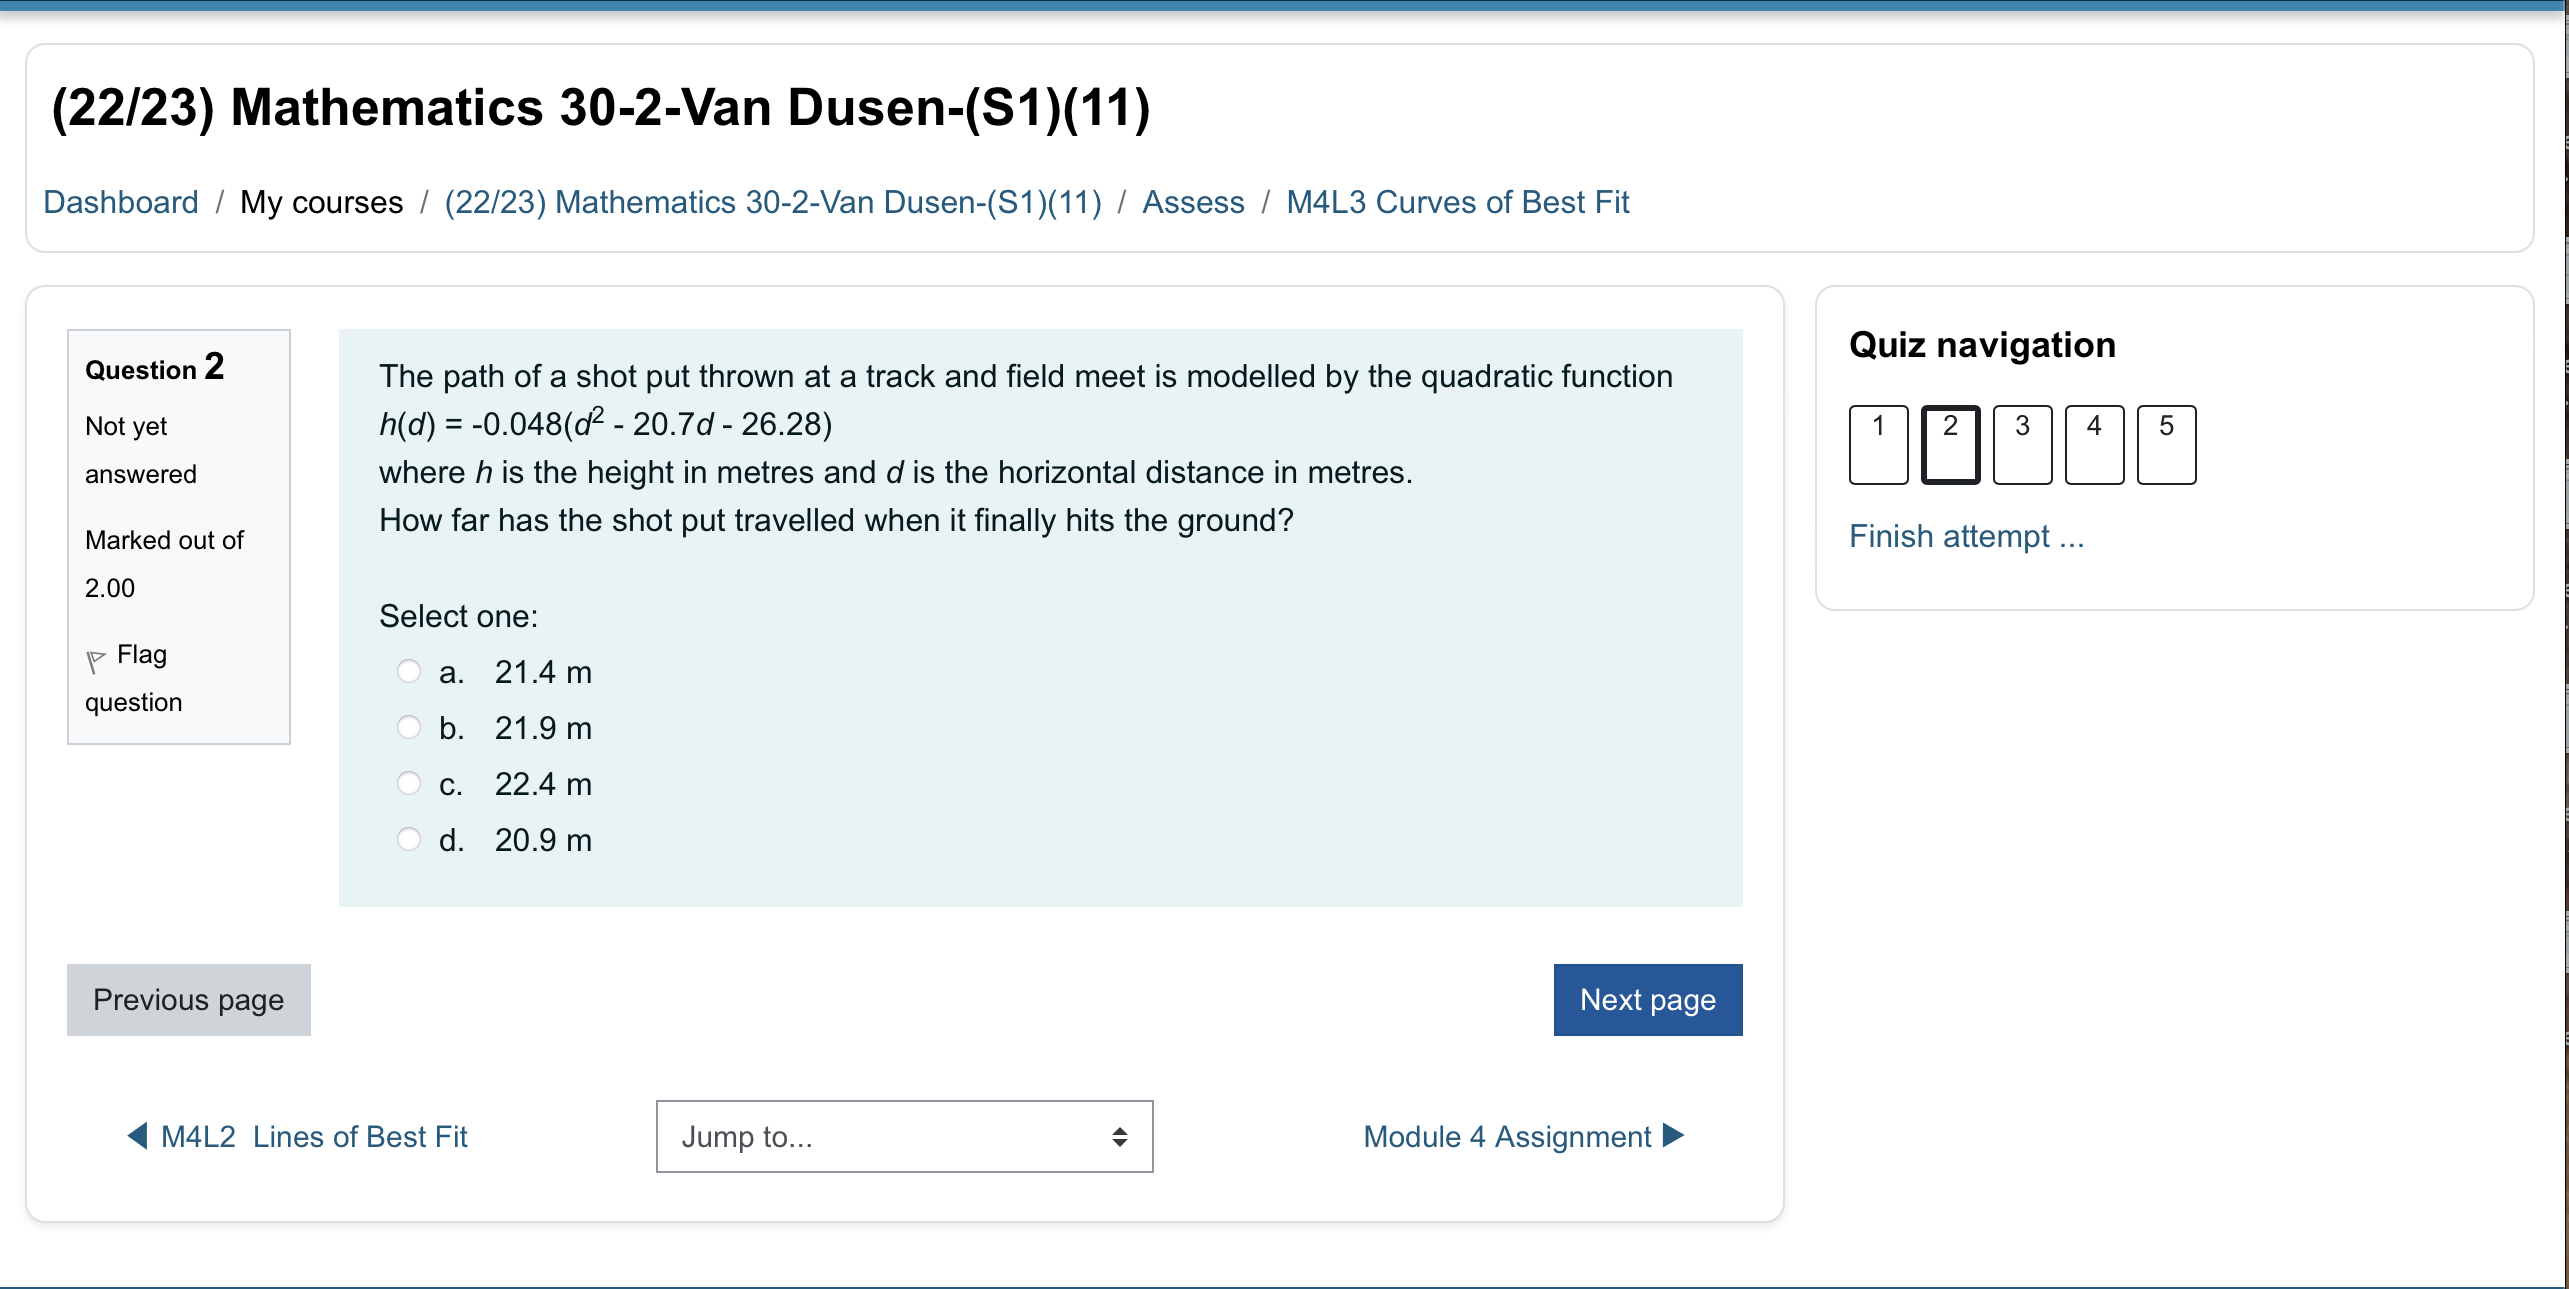
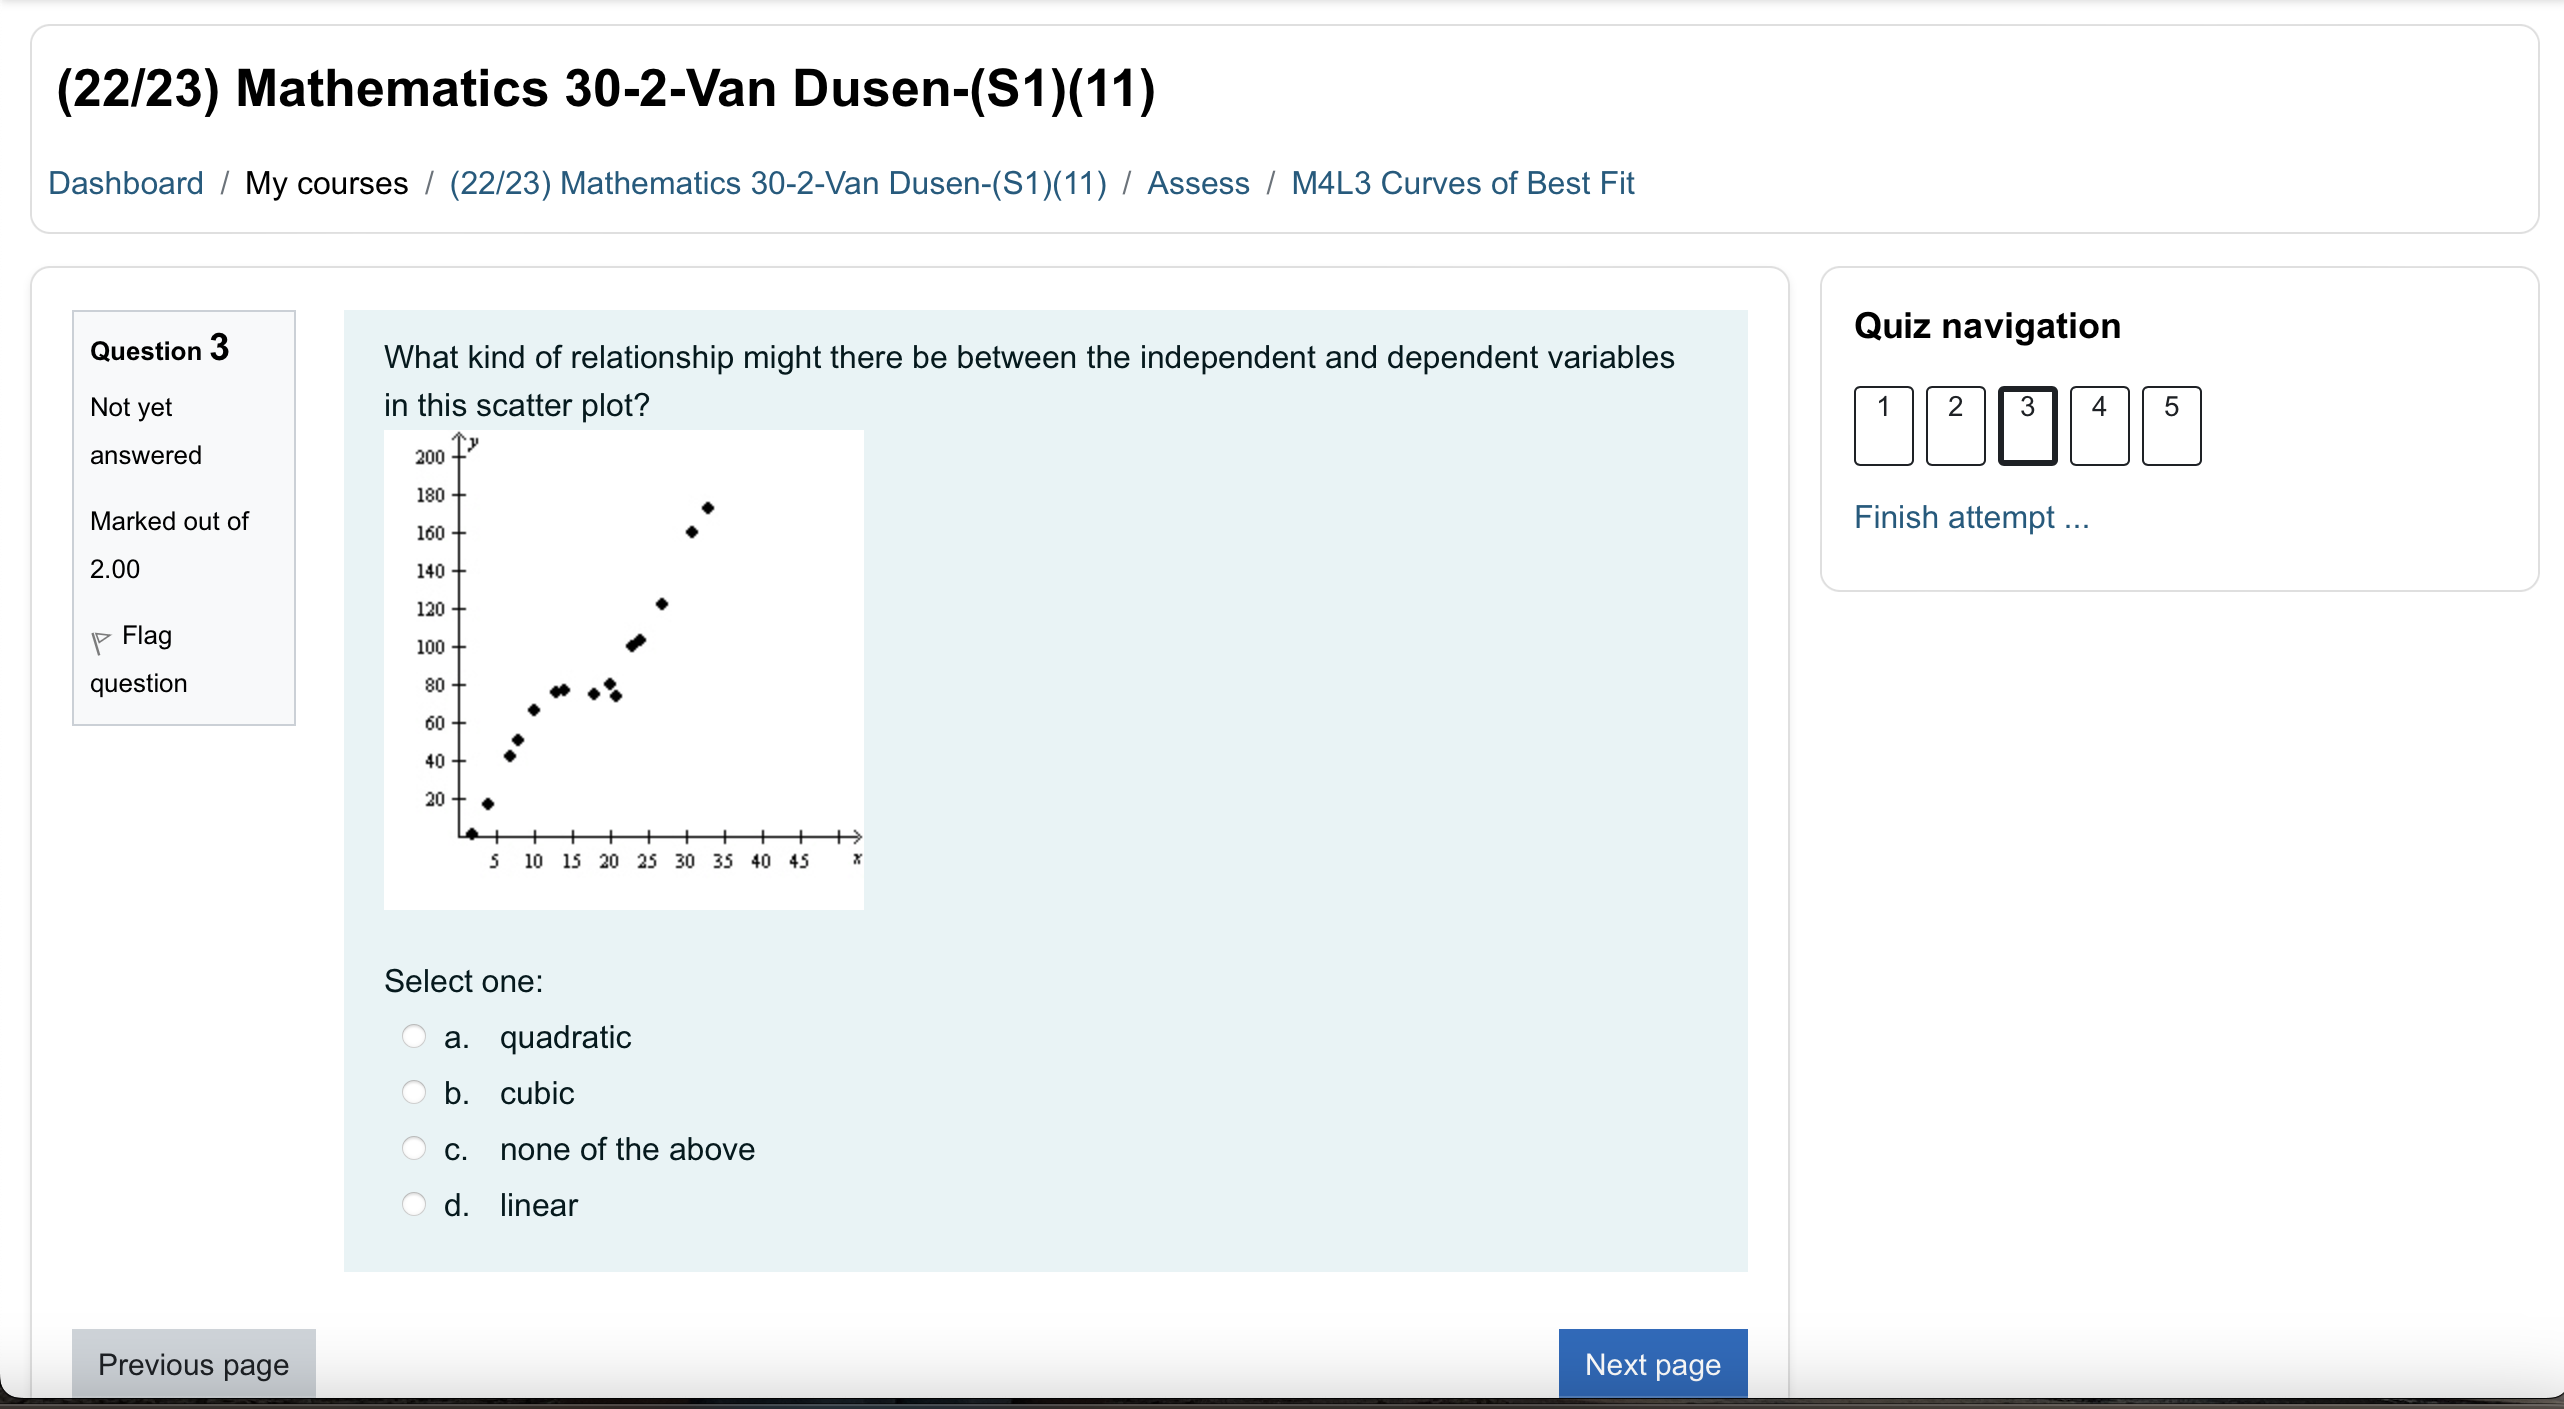
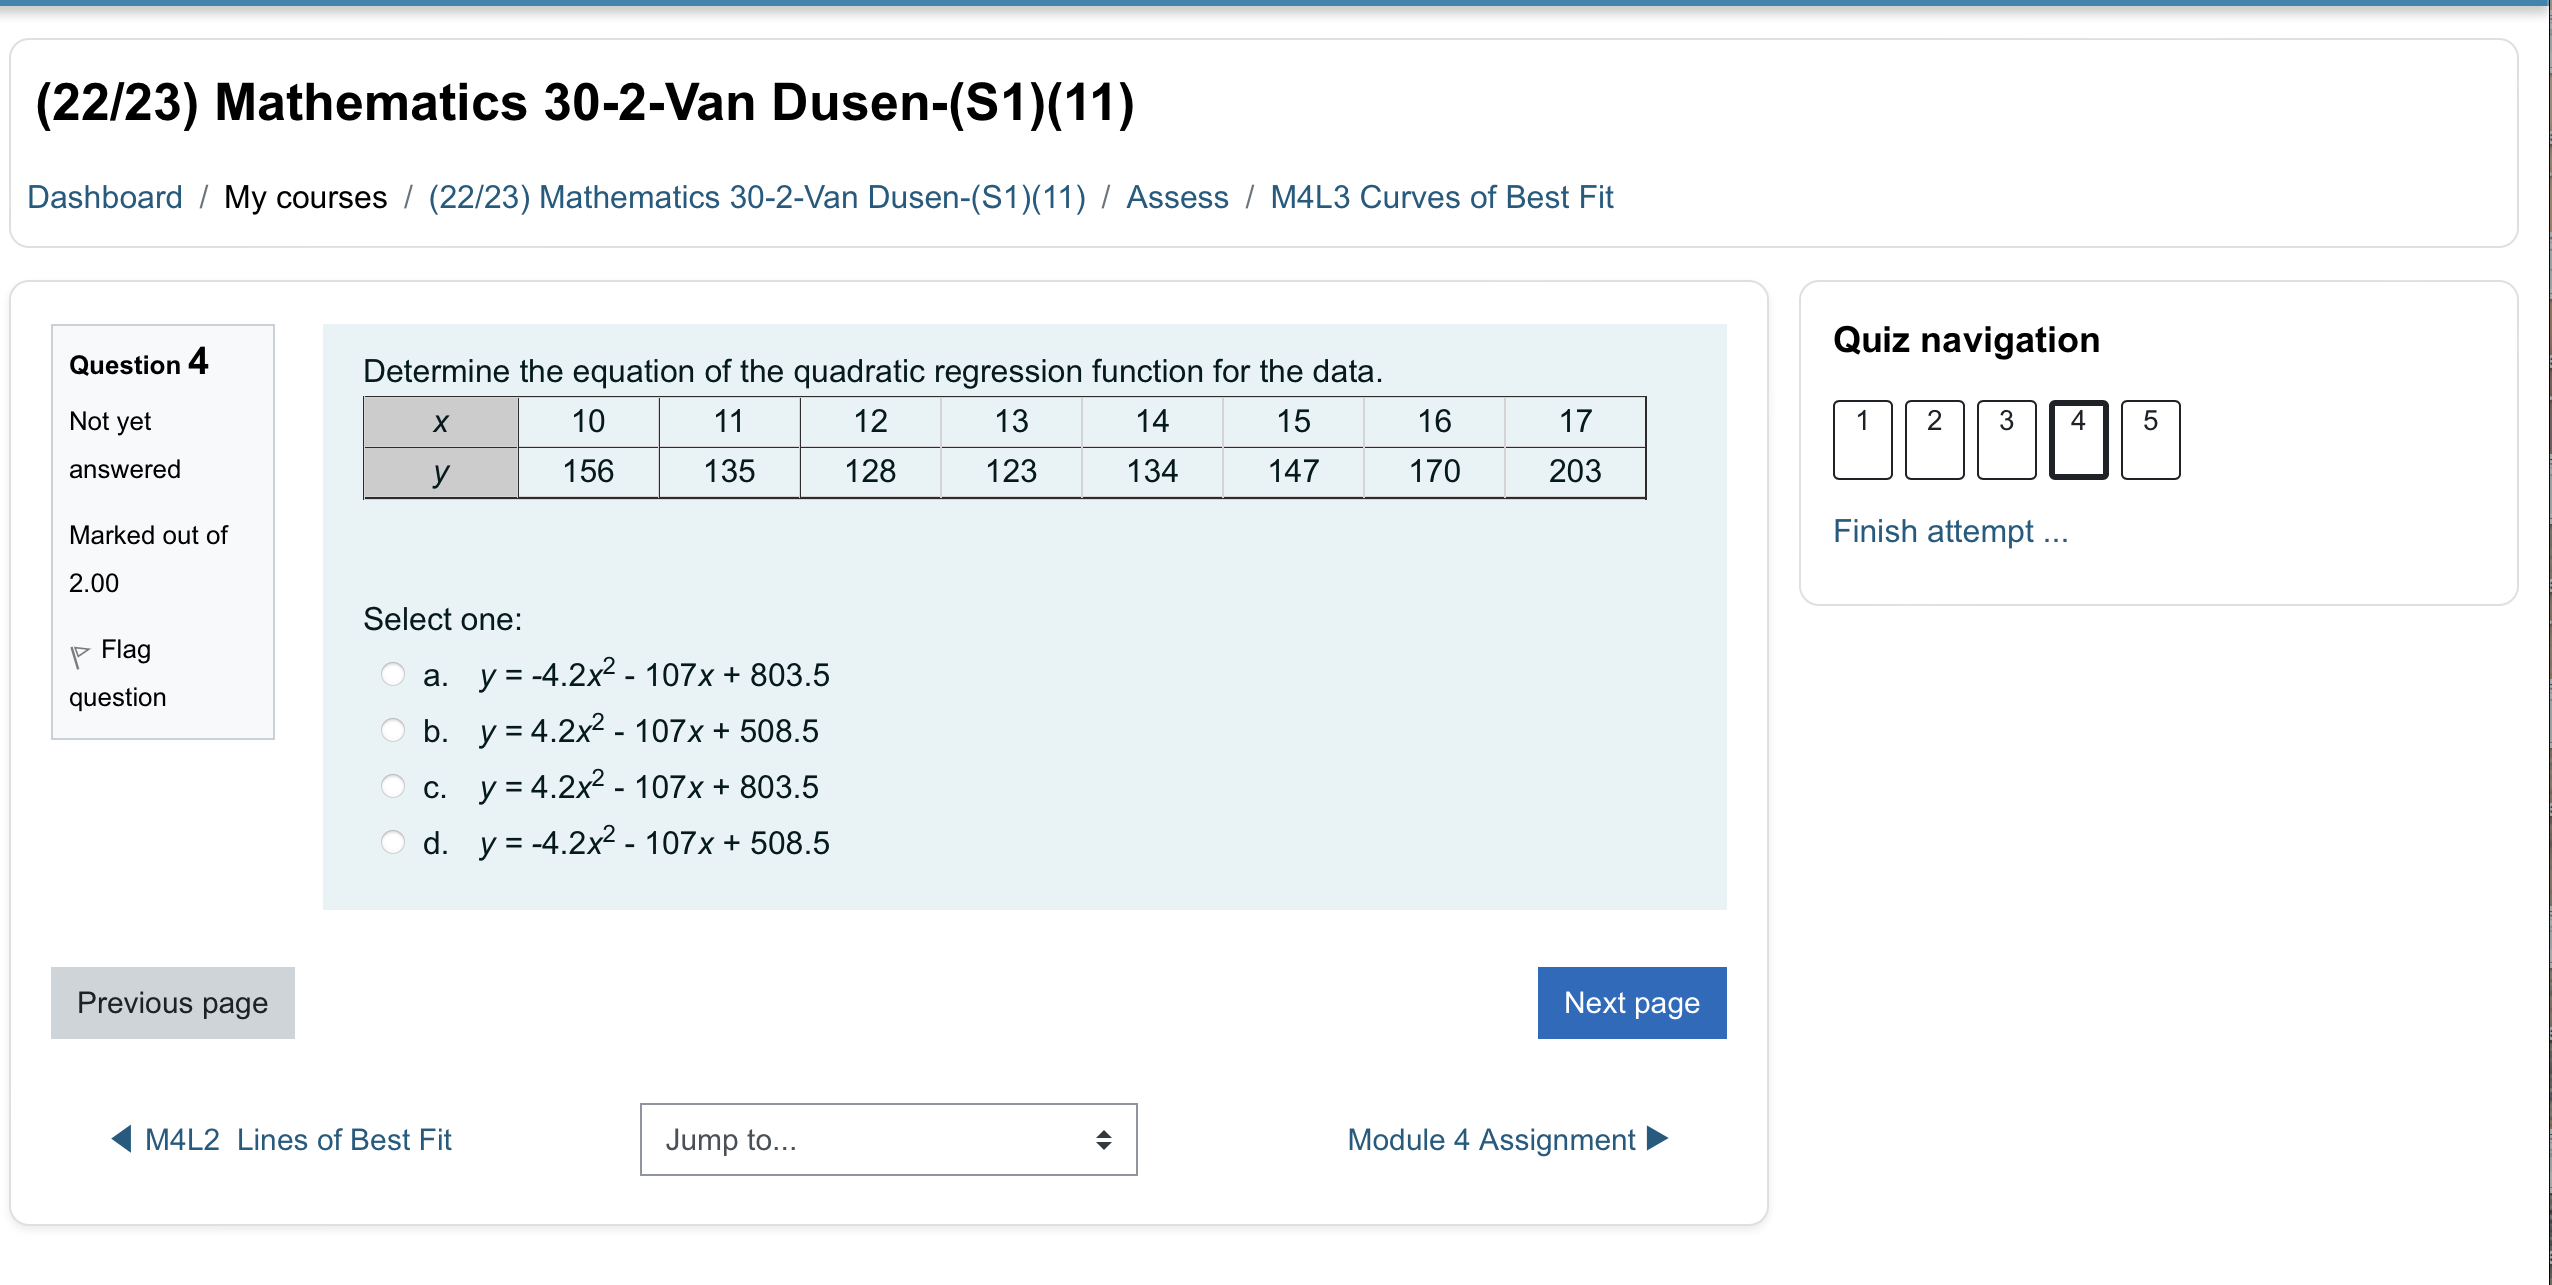
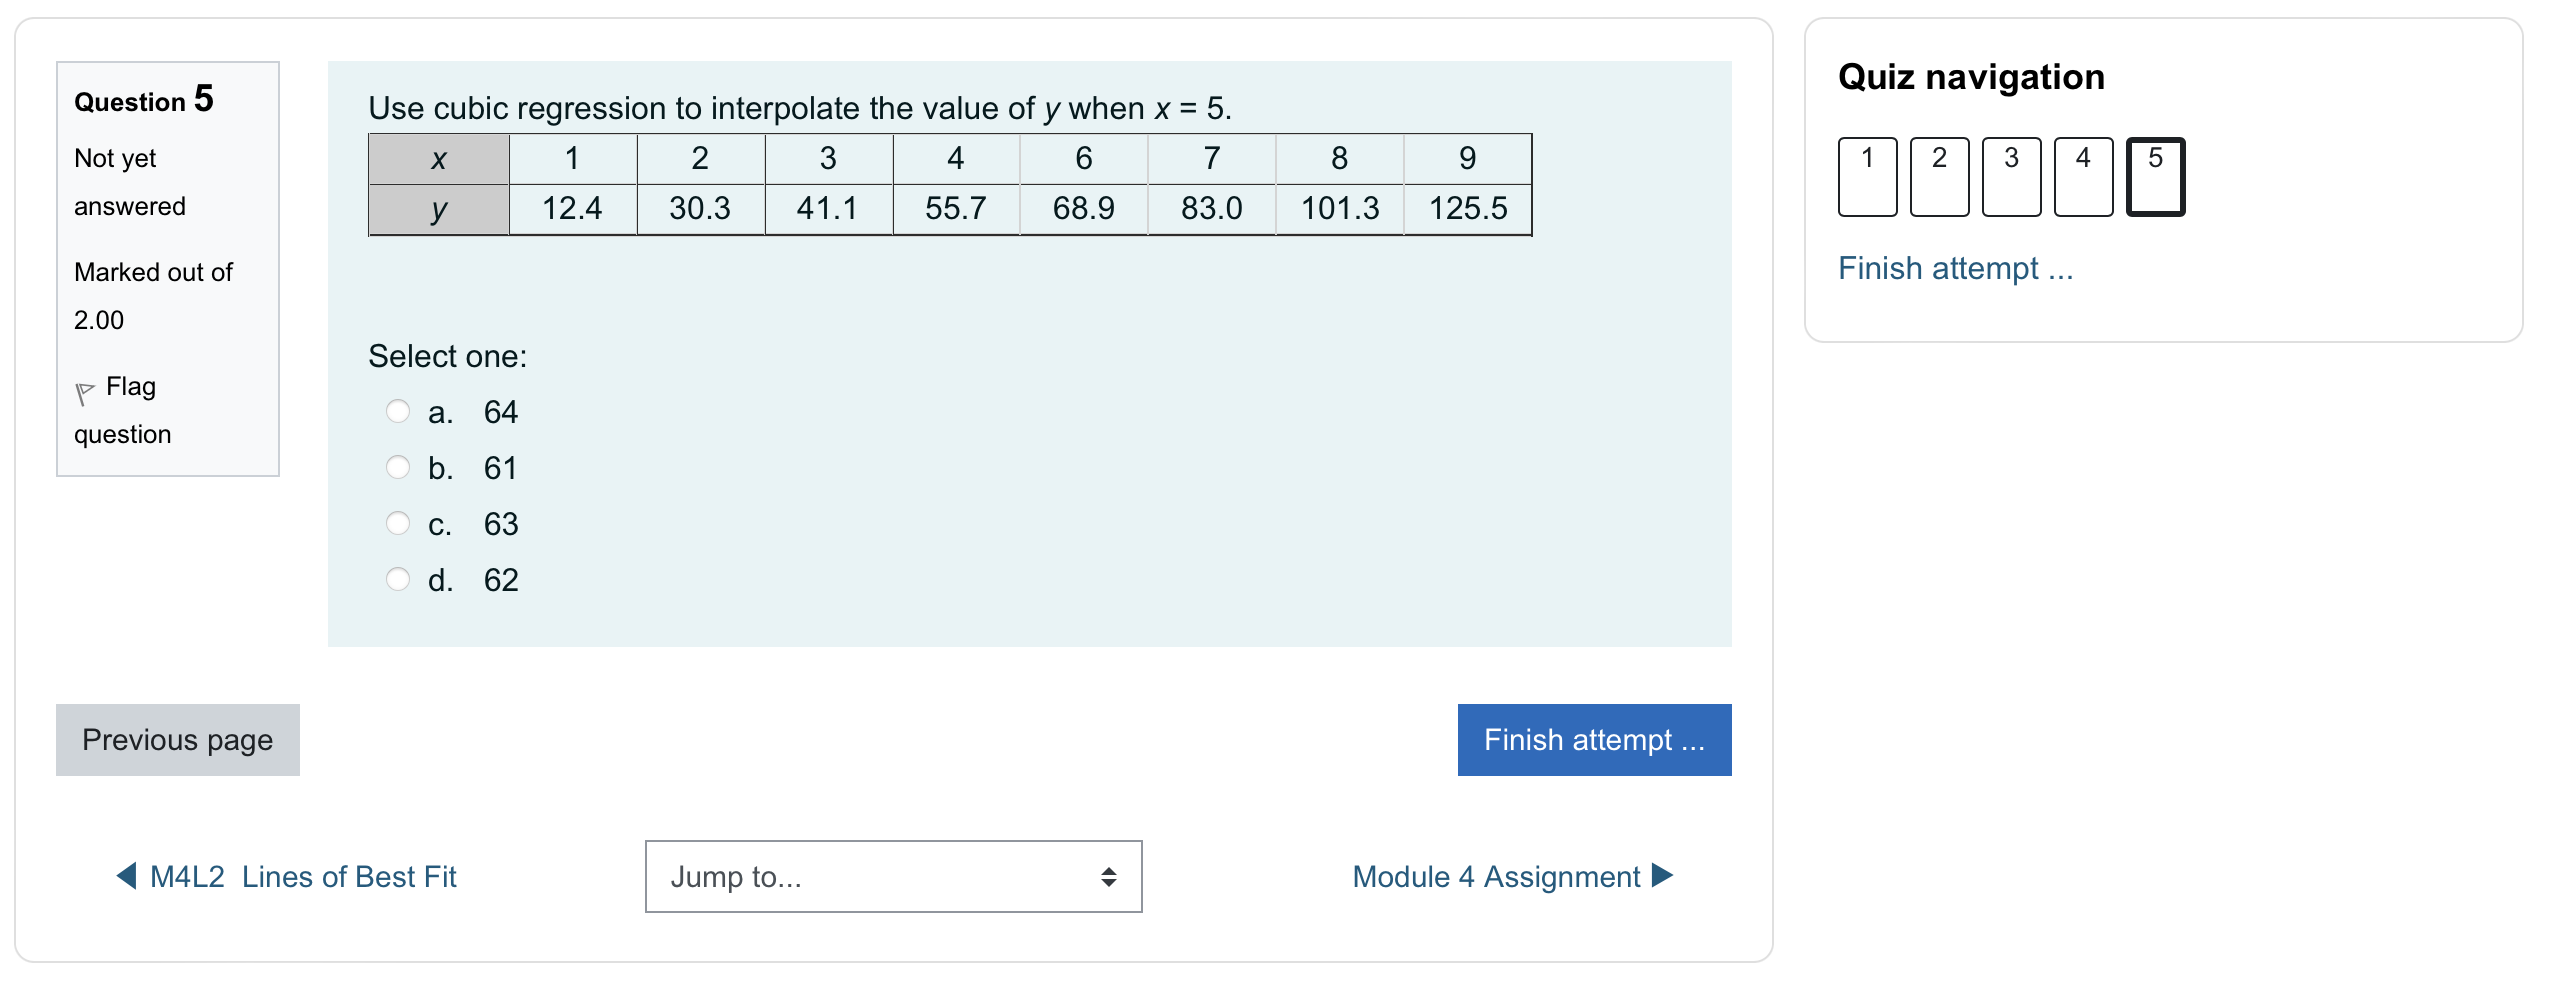
Question 1 Answer saved Marked out of 2.00 V7 Flag question Quiz navigation Finish attempt A scatterplot with a line of best fit is shown below: C 5 10 15 20 25 30 35 >V' Use the line of best fit to estimate the value of x when y = 25. Are you using interpolation or extrapolation? Select one: a. 15, extrapolation b. 10, extrapolation c. 10, interpolation 0 d. 15, interpolation Clear my choice (22/23) Mathematics 30-2-Van Dusen-(S1)(11) Dashboard / My courses / (22/23) Mathematics 30-2-Van Dusen-(S1)(11) / Assess / M4L2 Lines of Best Fit Question 2 Quiz navigation Determine the equation of the linear regression function for the data. Not yet X 2 3 4 5 6 1 2 3 4 5 answered y 84 155 241 310 405 478 Marked out of Finish attempt ... 2.00 Select one: Flag O a. y= 78.1x - 1.07 question O b. y= 79.7x + 0.07 O c. y= 78.1x + 1.07 O d. y= 79.7x - 0.07 Previous page Next page M4L1 Poly Funct and Graphs Jump to... M4L3 Curves of Best Fit(22/23) Mathematics 30-2-Van Dusen-(S1)(11) Dashboard / My courses / (22/23) Mathematics 302-Van Dusen-(S1)(11) / Assess / M4L2 Lines of Best Fit Question 3 Not yet answered Marked out of 2.00 \\v Flag question Previous page The cost of a taxi ride in Regina, for several distances, is given in the table below: Distance (km) 37.95 2.22 The equation of the linear regression function for this data is ( use your calculator) Select one: a. y = 4.96x +1.71 b. y=5.11x+ 1.82 c. y=1.82x+5.11 d. y =1.71X +4.96 Next page Quiz navigation WIIII Finish attempt (22/23) Mathematics 30-2-Van Dusen-(S1)(11) Dashboard / My courses / (22/23) Mathematics 30-2-Van Dusen-(S1)(11) / Assess / M4L2 Lines of Best Fit Quiz navigation Question 4 Describe the characteristics of the trend in the data. Answer saved an I I 18 Marked out of 15 2.00 H Finish attempt 12 \\V Flag 10 question poo-am 246310121'l618" Select one: a. decreasing b. no trend 0 c. constant d. increasing Clear my choice Previous page _ext page (22/23) Mathematics 30-2-Van Dusen-(S1)(11) Dashboard / My courses / (22/23) Mathematics 302-Van Dusen-(S1)(11) / Assess / M4L2 Lines of Best Fit Question 5 Answer saved Marked out of 200 \\v Flag question Estimate the slope for a line that best approximates the data in the scatter plot. 20 18 16 14 12 10 use. 24681012141613" Select one: 0 a. -1 b. 1 c. 4 d. -4 Clear my choice Quiz navigation "\"9 Finish attempt (22/23) Mathematics 30-2-Van Dusen-(S1)(11) Dashboard / My courses / (22/23) Mathematics 30-2-Van Dusen-(S1)(11) / Assess / M4L3 Curves of Best Fit Quesmn 1 The average retail price of gas in Canada from 1979 to 2008 can be modelled by the function Not yet PM = 0.008y3 - 0.307y2 + 4.830y + 25.720 answered where P is the price of gas in cents per litre and y is the number of years after 1979. Marked out of 2.00 Select one: \\VF'ag a. 71.7/L question b 68.8/L c. 69.8/L d 70.4/L 4 M4L2 Lines of Best Fit Determine the average price of gas in 2002. Jump to... 0 Next page Module 4 Assignment D Quiz navigation Finish attempt (22/23) Mathematics 30-2-Van Dusen-(S1)(11) Dashboard / My courses / (22/23) Mathematics 30-2Van Dusen(Si)(11) / Assess / M4L3 Curves of Best Fit Quesmn 2 The path of a shot put thrown at a track and field meet is modelled by the quadratic function Not yet h(d) : -0.048(d2 - 20.7d - 26.28) answered where h is the height in metres and d is the horizontal distance in metres. . . . ,7 Marked out of How far has the shot put travelled when It finally hits the ground. 2.00 Select one: \\V Hag a. 21.4 m question b. 21.9 m c. 22.4 m d. 20.9 m Previous page 4 M4L2 Lines of Best Fit Jump to... 0 Module 4 Assignment V Quiz navigation l1Il3l 4ll5l Finish attempt (22/23) Mathematics 30-2-Van Dusen-(S1)(11) Dashboard / My courses / (22/23) Mathematics 30-2-Van Dusen-(Sl)(11) / Assess / M4L3 Curves of Best Fit _ Quiz navigation Quesmn 3 What kind of relationship might there be between the independent and dependent variables Not yet in this scatter plot? answered 200 180 160 Marked out of Finish attempt 2.00 140 120 \\V Flag we question so so 40 20 5 10 15 20 25 30 35 #0 .5 " Select one: a. quadratic b. cubic 0. none of the above d. linear Previous page next page (22/23) Mathematics 30-2-Van Dusen-($1)(11) Dashboard / My courses / (22/23) Mathematics 30-2-Van Dusen-(S1)(11) / Assess / M4L3 Curves of Best Fit Question 4 Quiz navigation Determine the equation of the quadratic regression function for the data. Not yet X 10 11 12 13 14 15 16 17 2 3 4 5 answered y 156 135 128 123 134 147 170 203 Marked out of Finish attempt ... 2.00 Select one: Flag O a. y=-4.2x2 - 107x + 803.5 question O b. y= 4.2x2 - 107x + 508.5 O c. y = 4.2x2 - 107x + 803.5 O d. y=-4.2x2 - 107x + 508.5 Previous page Next page M4L2 Lines of Best Fit Jump to... Module 4 AssignmentQuestion 5 Not yet answered Marked out of 2.00 \\v Flag question Previous page Use cubic regression to interpolate the value ofy when x = 5. X 1 2 3 4 6 7 8 9 y 12.4 30.3 41.1 55.7 68.9 83.0 101.3 125.5 Select one: a. 64 b. 61 c. 63 d. 62 Jump to... Module 4 Assignment F 4 M4L2 Lines of Best Fit Quiz navigation Finish attempt
Step by Step Solution
There are 3 Steps involved in it
Step: 1
Get Instant Access to Expert-Tailored Solutions
See step-by-step solutions with expert insights and AI powered tools for academic success
Step: 2
Step: 3
Ace Your Homework with AI
Get the answers you need in no time with our AI-driven, step-by-step assistance