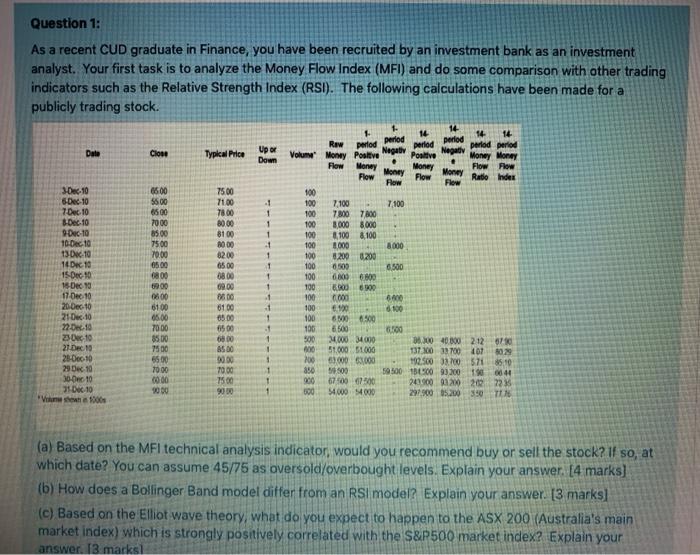
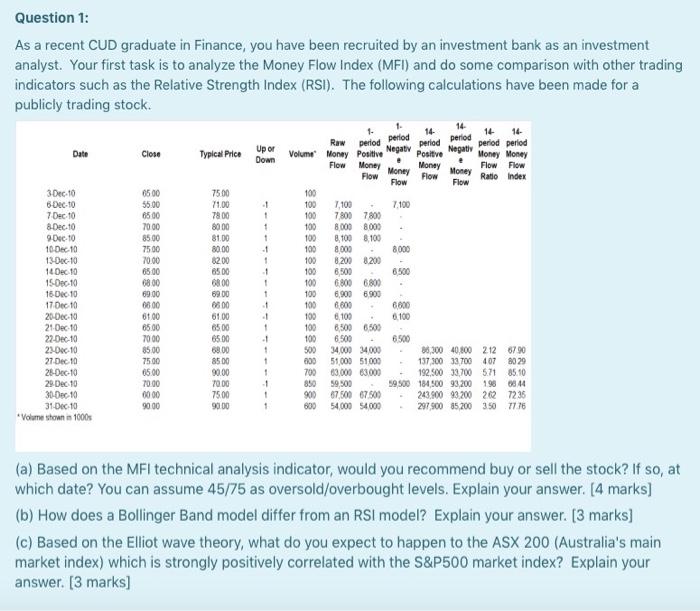
Question 1: As a recent CUD graduate in Finance, you have been recruited by an investment bank as an investment analyst. Your first task is to analyze the Money Flow Index (MFI) and do some comparison with other trading indicators such as the Relative Strength Index (RSI). The following calculations have been made for a publicly trading stock. Date Close Typical Price Upor Down Volume Money Flow Flow Flow 6500 5500 7.100 6500 .1 1 1 7000 85.00 7500 70.00 65.00 200 8.000 1 1 30-10 6 Dec 10 7.Dec. 10 B.Dec10 9-Dec-10 10 Dec 10 13.10 14D 10 15. Dec 10 15 Dec 13 17 Dec 10 20 Dec 10 21010 22.02.10 23010 21 Dec 10 25-Dec10 29 Dec 10 30-0ec 10 31 06.10 whe 6,500 75.00 71.00 7800 80.00 8100 2000 8200 65.00 8800 09.00 360 8100 0500 6500 6800 8500 0.00 7000 750 9000 100 100 100 100 100 100 100 100 100 100 100 100 100 100 500 1 1 . 1 1 . 7100 7800 70 3.000 8.000 100 8,100 1.000 8.200 3200 0500 6800 6.800 B. 6900 1000 10 60 6.500 6500 24000 34000 51.000 51000 63.000 6000 50.00 6700 1700 54.000 14000 0800 6100 65.00 7000 8500 7500 6500 10.00 00:00 9000 6.100 200 850 900 500 600 00.00 40.00 2 12 10 137.00 33700401 1023 192.500 33.00 571 85 10 59500 1000 920010 0044 240.000 2120 207235 297.500 05.200 390 TUM (a) Based on the MFI technical analysis indicator, would you recommend buy or sell the stock? If so, at which date? You can assume 45/75 as oversold/overbought levels. Explain your answer. [4 marks] (b) How does a Bollinger Band model differ from an RSi model? Explain your answer. [3 marks (c) Based on the Elliot wave theory, what do you expect to happen to the ASX 200 (Australia's main market index) which is strongly positively correlated with the S&P500 market index? Explain your answer. 13 marksi Question 1: As a recent CUD graduate in Finance, you have been recruited by an investment bank as an investment analyst. Your first task is to analyze the Money Flow Index (MFI) and do some comparison with other trading indicators such as the Relative Strength Index (RSI). The following calculations have been made for a publicly trading stock. Date Close Typical Price Upor Down Flow 75.00 7100 78 00 8000 81.00 80.00 8200 6500 3-Dec-10 6-Dec-10 7 Dec 10 8-Dec-10 9-Dec-10 10 Dec 10 13-Dec-10 14 Dec 10 15 Dec. 10 16 Dec 10 17 Dec 10 20-Dec-10 21-Dec 10 22-Dec-10 21-Dec-10 27 Dec 10 26-Dec-10 29 Dec 10 30 Dec 10 31-Dec 10 *Volumestown 10005 0800 6500 55.00 6500 70.00 8500 7500 70.00 65.00 6800 69.00 68.00 6100 65.00 7000 85.00 75.00 65.00 70.00 0000 9000 14 14 14 Raw period period period period period period Volume Money Positive Negaty Positive Negativ Money Money e Flow Money . Money Money Flow Flow Flow Money Ratio index Flow Flow 100 100 7.100 7.100 100 7800 7800 100 8000 8000 100 8100 8100 100 8.000 8000 100 8.200 8.200 100 8.500 6500 100 6800 6800 100 6,900 6.900 100 6.600 6.800 100 6.100 6.100 100 6,500 6500 100 6500 6.500 500 34000 34.000 36,300 40,800 212 6790 000 51000 51000 137 300 33700407 8029 700 63.000 63.000 192,500 33,700 571 85.10 850 59,500 19500 184,500 93,200 198 0944 900 67,500 67.500 243.900 93200 202 7235 54000 54000 297,900 45200 350 7776 -1 + + + 1 1 1 1 1 . -1 + .. 1 1 1 -1 1 1 69.00 6800 61.00 6500 6500 8500 90.00 70.00 75.00 9000 (a) Based on the MFI technical analysis indicator, would you recommend buy or sell the stock? If so, at which date? You can assume 45/75 as oversold/overbought levels. Explain your answer. [4 marks] (b) How does a Bollinger Band model differ from an RSI model? Explain your answer. [3 marks] (c) Based on the Elliot wave theory, what do you expect to happen to the ASX 200 (Australia's main market index) which is strongly positively correlated with the S&P500 market index? Explain your answer. [3 marks] Question 1: As a recent CUD graduate in Finance, you have been recruited by an investment bank as an investment analyst. Your first task is to analyze the Money Flow Index (MFI) and do some comparison with other trading indicators such as the Relative Strength Index (RSI). The following calculations have been made for a publicly trading stock. Date Close Typical Price Upor Down Volume Money Flow Flow Flow 6500 5500 7.100 6500 .1 1 1 7000 85.00 7500 70.00 65.00 200 8.000 1 1 30-10 6 Dec 10 7.Dec. 10 B.Dec10 9-Dec-10 10 Dec 10 13.10 14D 10 15. Dec 10 15 Dec 13 17 Dec 10 20 Dec 10 21010 22.02.10 23010 21 Dec 10 25-Dec10 29 Dec 10 30-0ec 10 31 06.10 whe 6,500 75.00 71.00 7800 80.00 8100 2000 8200 65.00 8800 09.00 360 8100 0500 6500 6800 8500 0.00 7000 750 9000 100 100 100 100 100 100 100 100 100 100 100 100 100 100 500 1 1 . 1 1 . 7100 7800 70 3.000 8.000 100 8,100 1.000 8.200 3200 0500 6800 6.800 B. 6900 1000 10 60 6.500 6500 24000 34000 51.000 51000 63.000 6000 50.00 6700 1700 54.000 14000 0800 6100 65.00 7000 8500 7500 6500 10.00 00:00 9000 6.100 200 850 900 500 600 00.00 40.00 2 12 10 137.00 33700401 1023 192.500 33.00 571 85 10 59500 1000 920010 0044 240.000 2120 207235 297.500 05.200 390 TUM (a) Based on the MFI technical analysis indicator, would you recommend buy or sell the stock? If so, at which date? You can assume 45/75 as oversold/overbought levels. Explain your answer. [4 marks] (b) How does a Bollinger Band model differ from an RSi model? Explain your answer. [3 marks (c) Based on the Elliot wave theory, what do you expect to happen to the ASX 200 (Australia's main market index) which is strongly positively correlated with the S&P500 market index? Explain your answer. 13 marksi Question 1: As a recent CUD graduate in Finance, you have been recruited by an investment bank as an investment analyst. Your first task is to analyze the Money Flow Index (MFI) and do some comparison with other trading indicators such as the Relative Strength Index (RSI). The following calculations have been made for a publicly trading stock. Date Close Typical Price Upor Down Flow 75.00 7100 78 00 8000 81.00 80.00 8200 6500 3-Dec-10 6-Dec-10 7 Dec 10 8-Dec-10 9-Dec-10 10 Dec 10 13-Dec-10 14 Dec 10 15 Dec. 10 16 Dec 10 17 Dec 10 20-Dec-10 21-Dec 10 22-Dec-10 21-Dec-10 27 Dec 10 26-Dec-10 29 Dec 10 30 Dec 10 31-Dec 10 *Volumestown 10005 0800 6500 55.00 6500 70.00 8500 7500 70.00 65.00 6800 69.00 68.00 6100 65.00 7000 85.00 75.00 65.00 70.00 0000 9000 14 14 14 Raw period period period period period period Volume Money Positive Negaty Positive Negativ Money Money e Flow Money . Money Money Flow Flow Flow Money Ratio index Flow Flow 100 100 7.100 7.100 100 7800 7800 100 8000 8000 100 8100 8100 100 8.000 8000 100 8.200 8.200 100 8.500 6500 100 6800 6800 100 6,900 6.900 100 6.600 6.800 100 6.100 6.100 100 6,500 6500 100 6500 6.500 500 34000 34.000 36,300 40,800 212 6790 000 51000 51000 137 300 33700407 8029 700 63.000 63.000 192,500 33,700 571 85.10 850 59,500 19500 184,500 93,200 198 0944 900 67,500 67.500 243.900 93200 202 7235 54000 54000 297,900 45200 350 7776 -1 + + + 1 1 1 1 1 . -1 + .. 1 1 1 -1 1 1 69.00 6800 61.00 6500 6500 8500 90.00 70.00 75.00 9000 (a) Based on the MFI technical analysis indicator, would you recommend buy or sell the stock? If so, at which date? You can assume 45/75 as oversold/overbought levels. Explain your answer. [4 marks] (b) How does a Bollinger Band model differ from an RSI model? Explain your answer. [3 marks] (c) Based on the Elliot wave theory, what do you expect to happen to the ASX 200 (Australia's main market index) which is strongly positively correlated with the S&P500 market index? Explain your answer. [3 marks]


